So, there’s an article published in yesterday’s Guardian titled, “The mathematical law that shows why wealth flows to the 1%,” which is fine, except for the fact that the “law” is not really a law, nor does it necessarily show “why” wealth flows anywhere.
To be fair, it’s a perfectly reasonable article with a crap, misleading headline, so I blame the editor, not the author.
The point of the article is to introduce the idea of a power law distribution, or heavy-tailed distributions more generally. These pop up all over the place, but are something that many people are not familiar with. The critical feature of such distributions, if we are talking about, say, wealth, is that an enormous number of people have very little, while a small number of people have a ton. In these circumstances it can be misleading, or at least uninformative, to talk about “average” wealth.
The introduction is nicely done, and it represents an important part of the “how” of wealth is distributed, but what, if anything, does it tell us about the “why”?
To try to answer that, we’ll walk through three distributions with the same “average,” to see what a distribution’s shape might tell us about the process that gave rise to it: Normal, Log Normal, and Pareto.
 |
The blue curve, with a peak at 300, is a Normal distribution. The red curve, with its peak around 50, is a Log Normal. The yellow one, with its peak off the top of the chart at the left, is a Pareto distribution.
In each case, the mean of the distribution is 300. |
The core of the issue, I think, is that there are three different technical definitions that we associate with the common-usage term “average,” the mean, the median, and the mode. This is probably familiar to most readers who have made their way here, but here’s a quick review:
The mean is what you usually calculate when you are asked to find the average of something. For instance, you would determine the average wealth of a nation by taking its total wealth and dividing it by the number of people.
The median is the point where half of the distribution lies to the right, and half lies to the left. So the median wealth would be the amount of money X where half of the people had more than X and half had less than X.
The mode is the high point in the distribution, its most common value. In the picture above, the mode of the blue curve is at about 300, while the mode of the red curve is a little less than 50.
The Normal (or Gaussian, or bell-curve-shaped) distribution, represented in blue, is probably the most familiar. One of the features of the Normal distribution is that the mode, median, and mean are all the same. So, if you have something that is Normally distributed, and you talk about the “average” value, you are probably also talking about a “typical” value.
Lots of things in our everyday experience are distributed in a vaguely Normal way. For instance, if I told you that the average mass of an apple was 5 ounces, and you reached into a bag full of apples, you would probably expect to pull out an apple that was somewhere in the vicinity of 5 ounces, and you might assume that you would be as likely to get an apple that was bigger than that as you would be to get one that was smaller. Or if I told you that the average height in a town in 5 feet, 8 inches, you might expect to see reasonable numbers of people who were 5’6″, fewer who were 5’2″, and fewer still who were 4’10”.
So what sorts of processes lead to a Normal distribution? The simplest way is if you have a bunch of independent factors that add up. For example, it is thought that a large number of genes affect height, with the specific variants of each gene that you inherited contributing a small amount to making you taller or less tall, in a way that is close enough to additive.
What would it mean, then, if we were to find that wealth was Normally distributed? Well, it could mean a lot of things, but a simple model that could give rise to a Normal wealth distribution would be one where the amount of pay each person received each week was randomly drawn from the same distribution. Maybe you would flip a coin, and if it came up heads, you would get $300, while tails would get you $100. Pretty much any distribution would work, as long as the same distribution applied to everyone. After many weeks, some people would have gotten more heads, and they would be in the right-hand tail of the wealth distribution. The unlucky people who got more tails would be in the left-hand tail. But most people’s wealth would be reasonably close to the mean of the wealth distribution.
Now, it’s important to remember that just because a particular mechanism can lead to a particular distribution, observing that distribution does not prove that your particular mechanism was actually at work. It seems like that should be obvious, but you actually see a disturbing number of scientific papers that basically make that error. There will typically be whole families of mechanisms that can give rise to the same outcome. However, looking at the outcome (the distribution, in this case) and asking what mechanisms are consistent with it is an important first step.
Alright, now let’s talk about the Log Normal distribution (the red one). Unlike the Normal, the Log Normal is skewed: it has a short left tail and a long right one. This means that the mean, mode, and median are no longer the same. In the curve I showed above, the mean is 300, the median is about 150, and the mode is about 35.
This is where talk about averages can be misleading, or at least easily misinterpreted. Imagine that the wealth of a nation was distributed like the red curve, and that I told you that the average wealth was $30,000. What would you think? Well, if I also told you that the wealth was Log Normally distributed, and I gave you some additional information (like the median, or the variance), you could reconstruct complete distribution of wealth, at least in principle.
The problem is that we tend to think intuitively in terms of distributions that look more like the Normal. In practice, we hear $30,000 average wealth, and we say, “Hey, that’s not too bad.” We probably don’t consciously recognize that (in this example), half of the people actually have less than $15,000, and that the typical (i.e., modal) person has only about $3500.
What type of process can give rise to a Log Normal distribution? Well, again, there are many possible mechanisms that would be consistent with a Log Normal outcome, but there is a class of simplest possible underlying mechanisms. We imagine something like the coin toss that we used in the Normal case, but now, instead of adding a random quantity with each coin toss, we multiply.
This is sort of like if everyone started off with the same amount of money invested in the stock market. Each week, your wealth would change by some percentage. Some weeks you might gain 2%. Other weeks you might lose 1%. If everyone is drawing from the same distribution of multipliers (if we all have the same chance of a 2% increase, etc.), the distribution of wealth will wind up looking Log Normally distributed.
 |
| Vilfredo Pareto, who grew a very long beard in order to illustrate the idea of a distribution with a very long tail. |
Finally, we come to the Pareto distribution. This is sort of like the Log Normal, but much more skewed. In the graph we started off with, the yellow Pareto distribution has a mean of 300, just like the Normal and Log Normal. But where the Normal had a median of 300, and the Log Normal had a median of 150, the Pareto had a median of only about 20.
In our wealth example, we could say that that average wealth in a nation was $30,000, but if that wealth was distributed like the yellow Pareto curve, half of the people in that nation would have less than $2000. Furthermore, 97% of the people in that nation would have less than that $30,000 average.
With a Pareto, the mode is as far left as we set the minimum value. In this case, it was set at 10. Under such a distribution, the “typical” person has as little wealth as possible.
The fact is, this extremely skewed sort of distribution, a Pareto or something like it, is what real-world wealth distributions tend to look like. [UPDATE: This is true of the rich, right tail of the distribution. The body of wealth distributions are more Log Normal. H/T Cosma Shalizi.]
The greatest success so far of the Occupy Wall Street movement may be that it is starting to make people understand just how skewed the distributions of wealth and income are, in this country and around the world. A graph
posted Friday on Politico shows the dramatic increase in the discussion of “income inequality” in the news over the past several weeks:
 |
| Dylan Byers plotted the number of times “income inequality” was mentioned in print news, web stories, and broadcast transcripts each week. The graph reveals a five-fold increase over the past two months. |
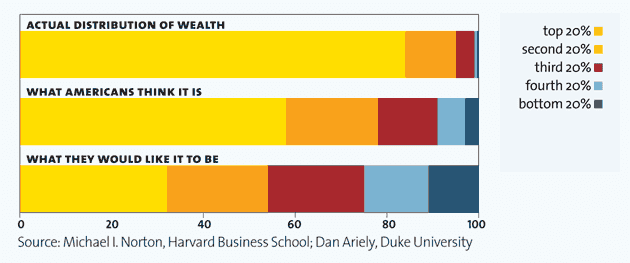
Consider that along with this graph, which is part of a
nice set of illustrations of American inequality put together by Mother Jones:
This graph reveals two things. First, that Americans think that wealth should be more equally distributed. Second, and more importantly for the sake of the current discussion, they dramatically underestimate the extent of the inequality that actually exists.
In the terms that we have been using here (and speaking very loosely), Americans think that wealth should be somewhat Normally distributed. They think that it is more Log Normally distributed. They fail to recognize that, in reality, it is more like Pareto distributed.
What types of processes can give rise to a Pareto distribution? Again, lots. What are the simplest models, though? Generative models that give rise to this sort of distribution tend to have some sort of positive feedback mechanism. Basically, the more money you have, the more leverage you have to make money in the future. In the simple models, you can start off with a bunch of things that are identical (like our nation of people who all start off with the same amount of money to put in the stock market). But now, if you do well, it increases your chances of doing well in the future: the people whose coins come up heads in the first few rounds are given new coins, which come up heads more than half of the time.
It is easy to list the features of our current economic system that lead to this sort of positive feedback loop: successful companies have the resources to undermine and disrupt smaller competitors, the rich have the ability through advertising and lobbying to steer public opinion and write public policy. If you didn’t read it when it came out, or haven’t read it recently, the Vanity Fair piece from May, “Of the 1%, by the 1%, for the 1%” provides an excellent overview of how increasing inequality leads to reduced opportunity, which leads, in turn, to further increases in inequality.
Power laws and Pareto distributions don’t show how or why wealth flows into the hands of the few. However, the nature and magnitude of wealth inequality hint at truths that we already know from experience: that wealth begets wealth, that the playing field is not always level, and that when inequality becomes great enough, hard work and ingenuity may have a hard time competing with privilege and access.
========================================================
In the “real” world of empirical data, there are two kinds of power laws: things that are actually power laws, and things that are not really power laws, but get called power laws because science thinks that’s sexier.
I think someone once said, “God grant me the the serenity to accept the things that are not power laws, the appropriate statistical tools to fit those that are, and the wisdom to know the difference.”
If the God thing doesn’t work out for you, a good back-up plan starts with this paper:
Clauset, A., Shalizi, C., & Newman, M. (2009). Power-Law Distributions in Empirical Data SIAM Review, 51 (4) DOI: 10.1137/070710111
Free version of the article available on the ArXiv, here: http://arxiv.org/abs/0706.1062


