Today, March 15, the Democratic primary will be allocating 691 delegates based on voting in Florida, Ohio, Illinois, Missouri, and North Carolina. Yesterday, I posted a rough calculation suggesting that Sanders would need to win about 351 of those delegates in order to be on track to win half of the pledged delegates before the convention.
[NB: If he wins more than that, it by no means guarantees that he will win the nomination. Similarly, if he wins fewer, it does not guarantee that Clinton will win. Which is to say, whomever you support, go vote! Also — maybe even more importantly — figure out who sucks the least in your local down-ballot races, and vote for them!]
So what is actually going to happen today? Well, if we look at the polling averages at aggregators like Real Clear Politics or 538, they suggest that Clinton will carry all five states, with big wins in Florida and North Carolina, and narrower margins in Ohio, Illinois, and Missouri. But is taking the polls at face value the best approach? (Spoiler: No)
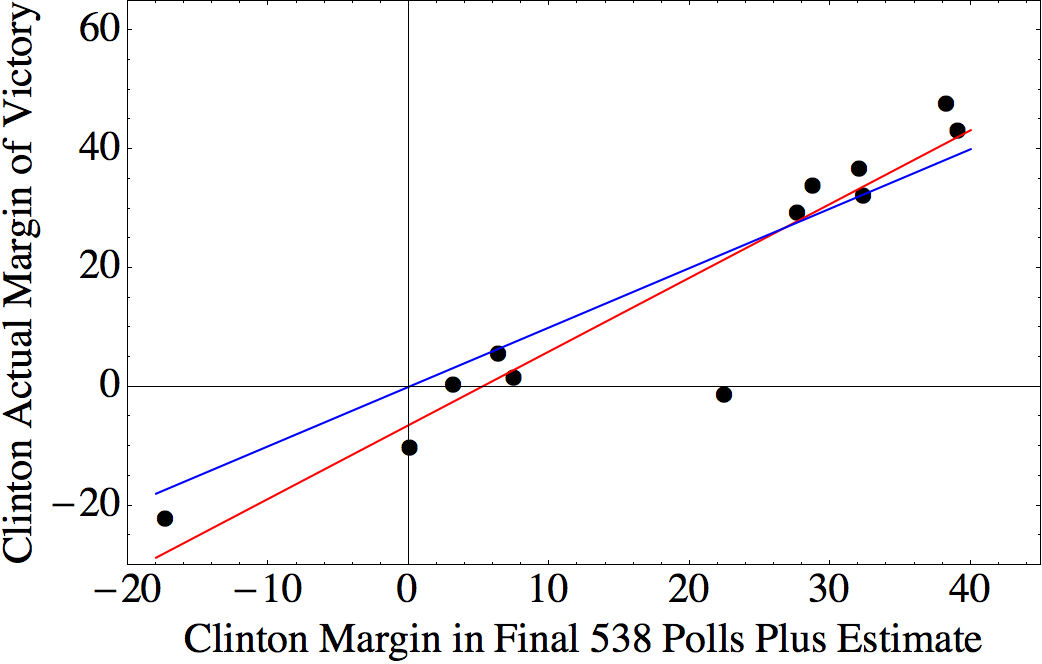
We’ve now had enough primaries that we can reasonably compare polling averages and actual outcomes. The following three graphs plot the advantage held by Clinton in the final polling averages or projections before each primary versus Clinton’s actual margin of victory. So, Sanders victories show up as negative numbers. These plots do not include states like Colorado and Minnesota, where there was very little polling before the primaries, and also leaves out Vermont and Mississippi — because you start to get non-linear behavior in landslides.
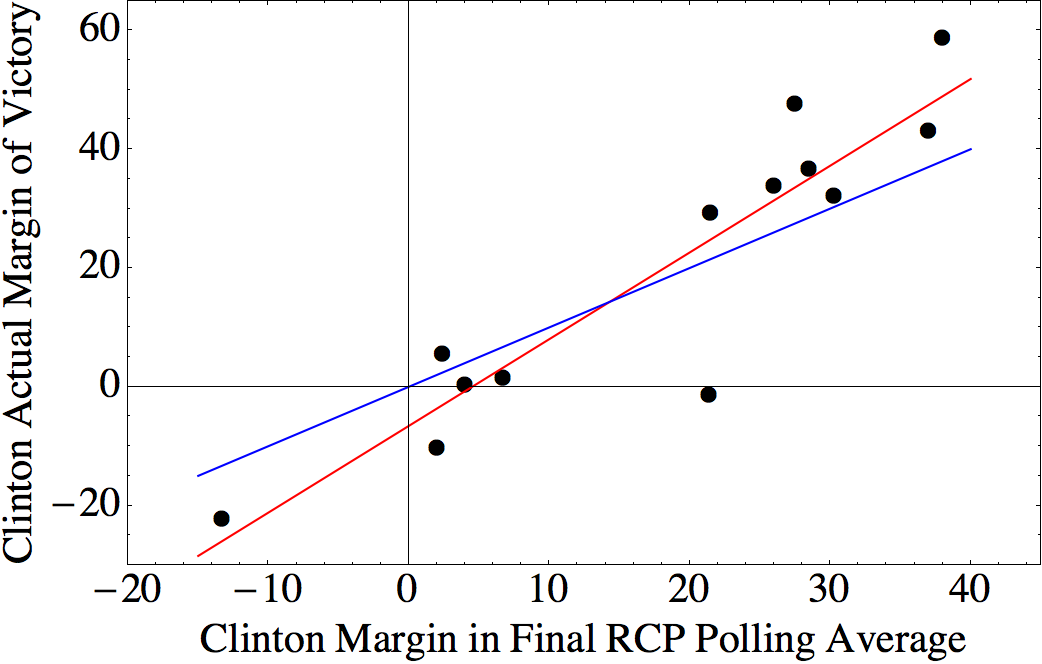
First, for Real Clear Politics’s polling averages:
The red line is a linear regression, and the blue line is what you would expect if polling were accurate. Michigan is a big outlier, but the rest of the results lie reasonably close to the line (overall R2 = 0.84).
Looking at the blue curve, it seems clear that the polls systematically underestimate the margins of Clinton’s victories in the states where she wins big, and they underestimate Sanders’s performance in states where the competition is close.
The slope of the red line is 1.46, and the intercept is –6.58. One interpretation of the >1 slope would be that undecideds tend to go with the winner, because they shake out proportional to the rest of the voters and/or due to a bandwagon effect. The negative intercept, on the other hand, suggests a systematic underestimation of Sanders’s support. Given the very pronounced difference in the typical ages of Sanders and Clinton supporters, and the high turnout of young voters in this primary, I’m inclined to think that this reflects a mismatch between polling firms’ likely voter models and reality.
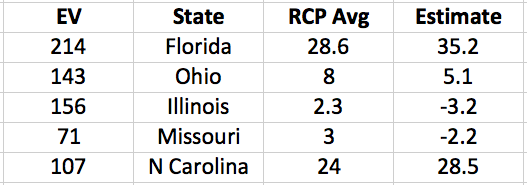
Whatever the reasons, the red line does give us a way to estimate likely outcomes based on the polling data. Here’s what that looks like:
Here, again, the values indicate Clinton’s expected margin of victory. This regression would predict narrow wins for Sanders in Missouri and Illinois, a narrow win for Clinton in Ohio, and huge wins for Clinton in Florida and North Carolina. This outcome would give Clinton about 399 delegates and Sanders 292.
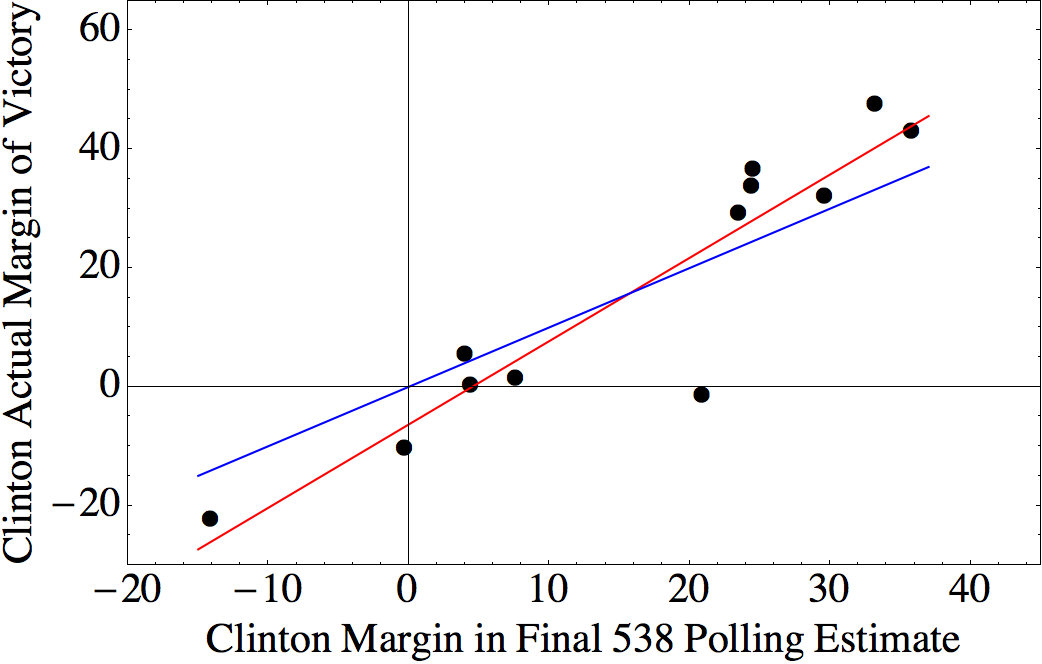
We can do the same thing for 538’s polling averages. The difference is that RCP uses a simple average of some number of the most recent polls, while 538 uses a continuous weighting scheme to account for poll recency as well as weights reflecting sample size and performance history of individual polling firms. The result is qualitatively similar, however:
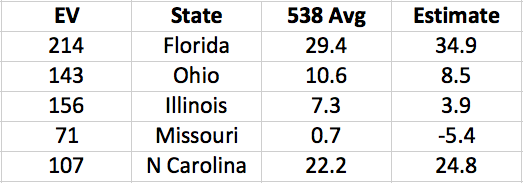
Here the slope is 1.4, offset –6.33, and R2 = 0.89. This predicts results of
Compared with the RCP analysis, this predicts a smaller margin for Clinton in North Carolina, but predicts that she will win Illinois. The predicted overall delegate haul is nearly identical, though: Clinton 403, Sanders 288.
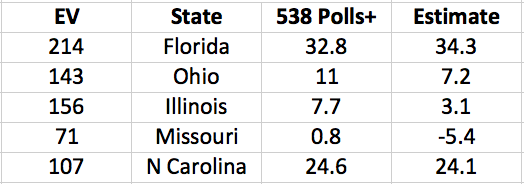
Finally, we can look at 538’s “Polls Plus” estimator, which includes information about things like endorsements:
Here, the slope is much lower, 1.24, indicating that this method has done a better job of predicting the magnitude of Clinton’s previous wins. The offset is similar, at –6.44, and the fit is the best of the three, with R2 = 0.91. Predicted results:
Projected delegate count: Clinton 401, Sanders 290.
This would, of course, fall quite short of Sanders’s target of 351.
So, in order not to lose even more ground to Clinton, Sanders would need to a substantial swing. Is that possible? The results in Michigan clearly indicate that it’s possible, although the results from all of the other states suggest that it’s not very likely.
There are a couple of places a substantial deviation could come from. First, if actual voter prefernce has been changing rapidly over the past week, the polling averages will naturally lag behind that change. Even individual polls are typically conducted over the course of a few days. So, if Clinton’s recent statements about Nancy Reagan, or the Chicago protests, or the Death Penalty, or Libya have alienated any Democrats, that may not be fully reflected in the polls.
Second, in states with open primaries, Democratic voters may cross over, particularly in light of the increasingly urgent anti-Trump movement. If those crossover voters are substantially more likely to be Clinton supporters than Sanders supporters, that would create a shift. A friend in Michigan told me, anecdotally, that she knows a number of Clinton supporters who did just this, partially due to the polls, which indicated that Clinton would win the state easily.
Adding a ten-point swing (e.g., due to 5% of voters switching from Clinton to Sanders) to the 538 Polling-Plus projections would give Sanders victories in Ohio, Illinois, and Missouri, and would produce a delegate count of Clinton 366, Sanders 325. This, incidentally, would be very close to 538’s uncorrected delegate targets.
Sanders would need a swing of about 17.5 points in order to reach the delegate target of 351, which accounts for Clinton’s current lead.
Of course, even if there is a swing, it is unlikely to be uniform across the states. Which means that it is finally time for tea-leaf reading!
I wanted to get down my own predictions, which are going to start from the 538 Polling Plus correction described above, but then use some intuition based on eyeballing the polls for trends and outliers. Here goes:
Florida: Clinton +30, Delegates: Clinton 139, Sanders 75
There’s a modest trend in the past few days that is not captured in 538’s average, but it may not have much effect, due to high rates of early voting in Florida.
Ohio: Sanders +1, Delegates: Sanders 72, Clinton 71
There’s again a sharp recent movement toward Sanders, and, if crossover votes do take away preferentially from Clinton, this is the state where we should see the biggest effect.
Illinois: Sanders +5, Delegates: Sanders 82, Clinton 74
Here, there are polls from March 7 and earlier, which all have Clinton leading by 20 to 40 points. Four polls with more recent data give Clinton an average lead of +2, and the three that are entirely from the last week give Clinton an average lead of less than 1 point.
Missouri: Sanders +8, Delegates: Sanders 38, Clinton 33
Very little polling data here, but, again, evidence of a recent shift towards Sanders.
North Carolina: Clinton +22, Delegates: Clinton 65, Sanders 42
Maybe a recent shift, but probably not more than a point or two.
Total: Clinton 382, Sanders 309
This would put Sanders still short of his targets, but, if he can actually claim victory in Ohio, Illinois, and Missouri, that will probably be enough to maintain his plausibility as a candidate. And so we will reconvene for the next round of primaries!
