Today, both the Republican and Democratic parties will be holding their primaries in New York. What should we expect from the Republican primary? Briefly, the most likely outcome is that Donald Trump will walk away with more than 80 of New York’s 95 delegates. The exact number will depend on the share of the vote that Trump gets, both statewide and in the various congressional districts. However, there are 27 congressional districts, which is a large enough number that we can predict the distribution of results, without worrying about the details of individual districts. That, along with New York’s delegate allocation rules, gives us the following curve:
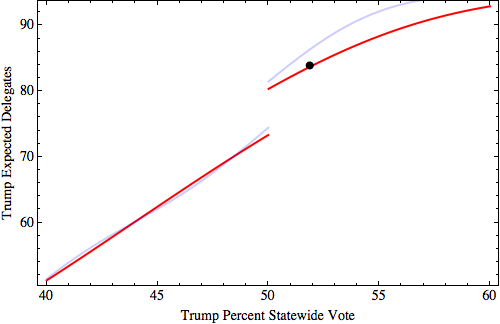
538’s final polling average has Trump at 52.1%. We can adjust this based on the relationship between Trump’s polling numbers and his final performance, but the adjustment turns out to be pretty small. Best guess is for Trump to get 51.9% of the vote, which would give him about 84 delegates.
That’s the headline. If you’re interested in the details, keep reading.
The red line is the predicted relationship and the black dot is the specific prediction. The blue line is an alternative predicted relationship based on a lower variance among congressional districts (details below).
Delegate Allocation
New York has a total of 95 delegates for the Republican primary. Fourteen of those are allocated based on the statewide results. The other 81 are allocated based on the results in the various congressional districts.
Statewide Delegates
If one candidate gets more than 50% of the statewide vote, they get all 14 of the statewide delegates. If not, delegates are allocated proportionally among the candidates receiving at least 20% of the vote. That’s what creates the discontinuity in the graph above. If Trump gets over 50%, he’ll get all 14. If he gets just under 50% (and Cruz and Kasich both get over 20%), he’ll probably get seven of them.
That graph assumes that both Cruz and Kasich get at least 20%. In the unlikely and very specific scenario where, say, Cruz gets 19.9% and Trump gets 49.9%, Trump would get about 5/8, or about 9 of the statewide delegates. That’s not a big difference, but it is sort of interesting that, in New York, it might be that a strategic anti-Trump movement would want to split their votes between Cruz and Kasich to ensure that both get over the threshold. That runs counter to the conventional wisdom in most states, which says that anti-Trump voters should rally behind whichever non-Trump candidate is more viable.
Congressional-District Delegates
Three delegates are allocated on the basis of the results in each of New York’s 27 congressional districts. Here are the rules that are relevant to the current election:
If one candidate receives more than 50% of the vote, they get all three delegates.
If not, the leading candidate gets two delegates, and the second-place candidate gets one.
Given Trump’s commanding lead in the polls, it seems likely that he will win most or all of the congressional districts. His delegate haul will depend primarily on the number of districts in which he gets over the 50% mark.
We can guess at this if we assume that the individual congressional districts are Normally distributed around a mean given by the statewide result. What we need, then, is a standard deviation for that distribution.
If we look at earlier Republican primary results, we find that the standard deviation among congressional districts clusters around two values. Most of the states for which results by congressional district are available have standard deviations of around 4, including Missouri, Mississippi, Texas, Tennessee, Oklahoma, Arkansas, and Alabama. But Wisconsin and Georgia both had standard deviations of around 7. My instinct is that New York is more like Wisconsin and Georgia, and the curve shown above uses a standard deviation of 7.
If we use a lower standard deviation, like 4, we get the blue curve in the figure above. The upper part of the curve gets a bit steeper. If Trump gets over 50% statewide, reduced variance among congressional districts means that he falls below 50% in fewer of those districts.
The lower part of the curve is fairly insensitive to the standard deviation. If Trump is below 50% on average, higher variance means that he gets over 50% in more congressional districts. However, it also means that he is more likely to come in second in other congressional districts. On the whole, it’s a wash. The curves above assumes that Trump comes in second in any CD where he receives less than 37% of the vote.