Going into today’s Democratic primary in Wisconsin, the polls have Sanders with an edge of 2-3 percentage points over Clinton. The obvious expectation would thus be that Sanders will win by about two or three points. Except that the polls have been wrong this primary season. I’m not talking about Michigan, where polling missed the election outcome by 20 points — or not just about Michigan anyway.
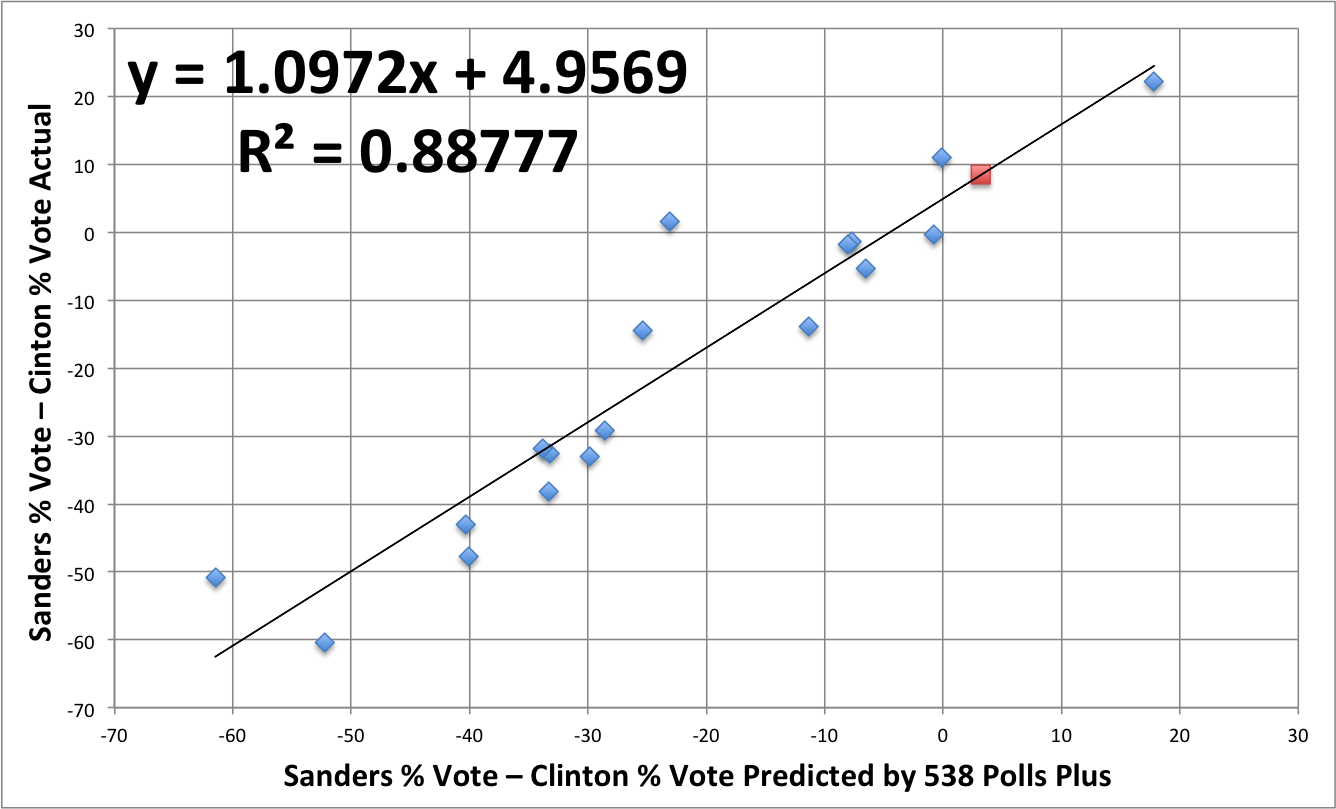
Previously, I did a simple linear regression on the primary results to date, comparing the final polling averages and projections to the actual outcome. I’ve updated that analysis with the more recent results, although the result is more or less the same:

When we compare the final polling averages to election outcomes, we find two things. First, the regression line has a slope greater than one: in the states where Clinton was expected to win big, she mostly outperformed expectations; in states where Sanders was favored, he tended to overperform. This sort of effect might come from a variety of places. For example, it could be that late-deciding voters tend to go with the candidate they think will win, or it could be that voters supporting a candidate very likely to lose become demoralized and stay home. Or, probably, lots of other things.
Second, there is an offset of about 5 points. That is, in close races, Sanders does about five points better on average than the final polling numbers would predict. I am fairly certain that this offset is due to a mismatch between the voter turnout models used by pollsters and the reality this election. Specifically, this election seems to have significantly higher turnout among younger voters compared with previous years. And those younger voters heavily favor Sanders. So, when a pollster constructs their final numbers using a model based on 2012 turnout, they underestimate the number of young Sanders supporters.
The final projection from 538’s Polling Plus model has Sanders winning 50.2% of the vote in Wisconsin to Clinton’s 47.2%. Plugging that into the regression formula gives a Sanders margin of victory of 8.3%.
In the Democratic primaries, delegate apportionment tends to track pretty close to the raw vote totals. So this would project Sanders to win about 46 of the state’s 86 pledged delegates.
In order to go into the national convention with half of the pledged delegates, Sanders needs to win a little over 56% of the remaining delegates. An eight-point win today would give him about 54% of today’s delegates, which would leave the race in pretty much the same state it has been in for a while: Sanders has a shot at overtaking Clinton, but you would not get anything close to even odds on it.
One methodological note: the regression presented here does not include any of the results from the last two rounds of primaries and caucuses — most of which Sanders won by large margins — because there was little to no polling data for those states in the run-up to their elections.
One final note: the conventional what-passes-in-political-punditry-as-wisdom is that Sanders does best in caucus states, while Clinton does better in primaries. That may be true, but all of the points included here are from primary states, with the exception of Nevada. (If we exclude Nevada, the projection changes only slightly: to Sanders by 8.8%.) So, even if there is a primary versus caucus effect, the fact that caucus states received so little polling means that is does not have much effect on this analysis.