So, Google has already had it’s Twitter account subpoenaed, and can look forward to months of molestation enhanced screening at the airport, all thanks to its brazen violation of Benford’s Law.
What is this Benford’s Law thing?
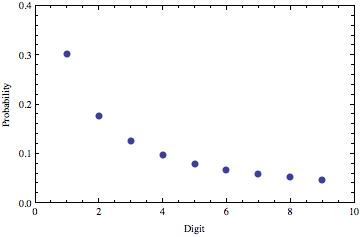
It is a statement that if you look at lists of numbers in empirical data, the first non-zero digit is distributed in a very specific way. At least for certain kinds of data. Specifically, if the logarithms of the numbers you are looking at are uniformly distributed, then the first digits of those numbers will be Benfordly distributed.
Here’s what the relative probabilities of different first digits look like:
Here’s a graphic that shows the frequencies of different letters and numbers in Google searches. The numbers are way down at the bottom.
 |
| Image via Gizmodo |
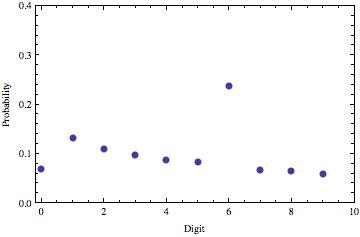
The thing that you’ll notice about this is that 6 is by far the most common digit (and that J/j is sad). Here’s a plot of these relative frequencies on the same scale as the Benford’s Law plot above.
Roughly speaking, this plot has the same shape as the one above, except for the fact that it includes 0, and that 6 is crazy. But, look at where the 0 value is: pretty much even with where you might expect the 6 to be. What happens if we assume that this was actually a transcription error that happened somewhere along the way? If we switch the 6 and 0 values, and then look at the relative probabilities of all of the non-zero digits, we get this:
The dark blue dots are the Benford’s Law points that we showed before. The reddish squares are the new empirical distribution.
Now that we’ve switched the 6 and the 0, we get something that looks to me like a mixture of the Benford’s Law distribution and a uniform distribution. But remember, Benford’s Law applies to first digits. This is data from all google searches. So, that’s going to be a mixture of first digits and non-first digits.
If we assume that 35% of the non-zero digits in searches are first digits, and that the other 65% are uniformly distributed between 1 and 9, we can back out the relative frequencies of the digits specifically in the first digit context.
The blue circles are the Benford’s Law expectations, and the red squares are the inferred empirical distribution of first digits. The choice of 35% was established through manual trial and error, and the fit was done by visual inspection. So, you know, don’t go and make any medical decisions based on this.
This is actually a reasonably good fit for this sort of thing, and constitutes fairly compelling evidence in support of the “sumbudy dun messed up” theory to my mind. Either that, or you have to invoke roughly 6 billion instances of people googling ‘666’.
Frank Benford (1938). The law of anomalous numbers Proceedings of the American Philosophical Society, 78 (4), 551-572


Gotta be a mistake. Google’s ngram viewer for digits 1-9 also shows a nice distribution according to Benford.