The US Presidential election system is weird, but the primary system is really weird. Contests are strung out over the course of five months, with the rules varying from state to state — from who can vote to how the voting happens to how the delegates are allocated among the candidates.
For the Democratic Party, there are 4051 “pledged” delegates, whose first-ballot votes at the convention are determined by the results of state-wide (or state-equivalent-wide) primaries, and 714 “superdelegates”, party leaders and insiders of various sorts who can vote for whomever they want.
Allocation of Delegates
The exact number of delegates assigned to a given jurisdiction is determined in a number of steps (details here). First, each jurisdiction is assigned a base number of delegate votes. For the 50 states and DC, this base is 3200 time an “allocation factor” that is the average of two quantities. Half of the allocation factor is set by the fraction of electoral college votes for the jurisdiction (e.g., 3/538 for DC and 29/538 for Florida). The other half is the fraction of the nationwide popular vote for the Democratic presidential candidate that came from that state over the previous three elections.
That second factor does two things. First, it makes the delegate allocation more proportional to population — reducing the advantage given by the electoral college system to smaller states. Second, it rewards states that tend to vote Democratic.
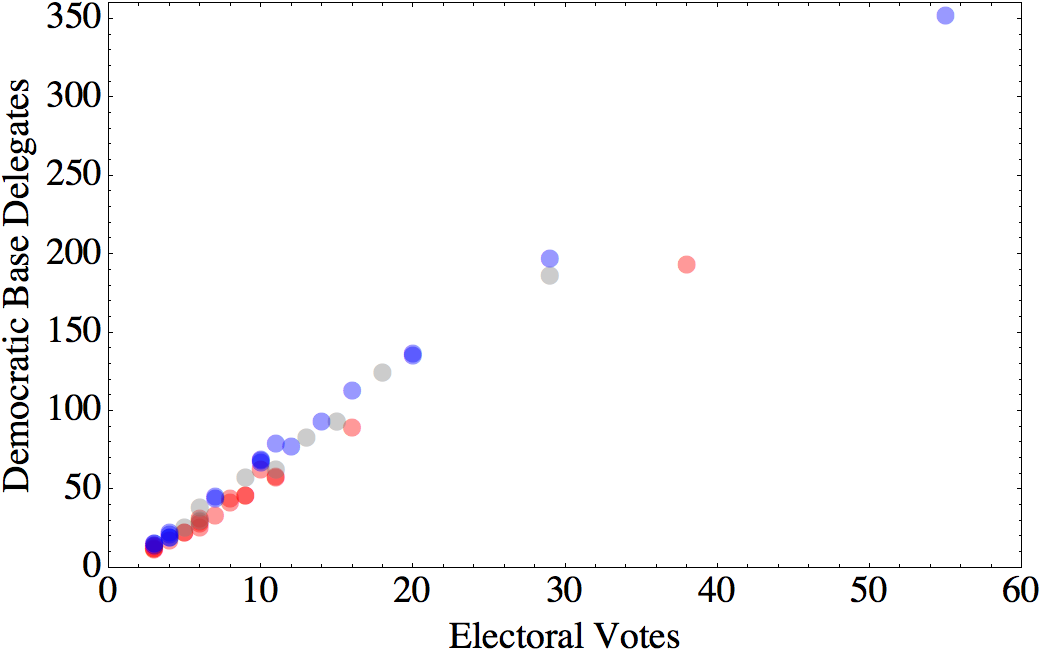
In this figure, blue dots indicate states that have gone for the Democratic candidate in each of the three previous elections, while red dots have gone for the Republican candidate in all three. Gray dots are states that have voted for the Democrat in either one or two of the three most recent elections. You can see that the slope of the red points is lower than that of the blue points.
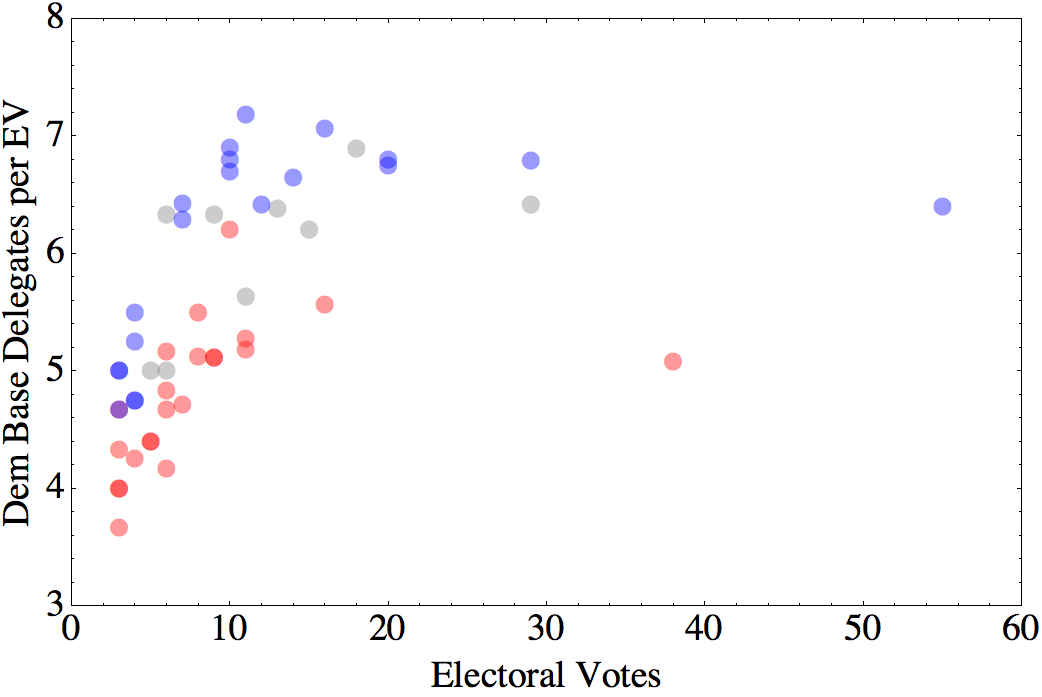
You can also see how this scheme down-weights the electoral value of the small states, since the apparent y-intercept is below zero. We can see this shift more clearly if we replot this in terms of the number of delegates per electoral vote:
Note that the apparent purple point is actually an overlay of red and blue (Montana and Vermont).
Then, each state is given various bonuses based on when they hold their primary. For example, you get a larger bonus for holding your primary later in the season. And, for primaries held March 22 or later, you get a 15% bonus if you are part of a cluster of three or more neighboring states with primaries on the same day.
(Because in Democratic primaries, as in the Special Olympics, everyone is a winner, no state has an overall bonus of less than 15%.)
Delegates are also assigned to various jurisdictions that don’t actually get to vote in the presidential election, like Puerto Rico, and to “Democrats Abroad”, people living overseas, who would vote in the presidential election via absentee ballot in their home state.
How SHOULD delegates be allocated?
So, is this a sensible way to allocate delegates? It depends on the goal. The current system seems to be basically a hybrid of the electoral college system and a popular vote, with some additional features to reward party loyalty. It seems that the system aims to strike a balance among three competing goals:
- Pragmatic considerations of electoral math. Elections are determined by the electoral college, so a system that mirrors the electoral college seems more likely to produce a candidate who can win.
- A democratizing impulse. At the same time, there is a sense that the electoral college system is weird and not always fair. Skewing delegate weights towards population size, allowing proportional allocation of delegates within states, and allowing participation by groups that are normally excluded from the Presidential election all make the primary outcome a bit more like a nationwide popular vote.
- Community Building. If you reward states that produce Democrats and get them to vote, as well as states that get in line and follow the rules, you presumably hope that this will lead to more of both.
However, if we take the pragmatic angle seriously, there is something missing from this calculation. In the current political environment, the outcome of a Presidential election depends primarily on how candidates perform in the swing states.
Barring a landslide, come November, the Democrats are going to win Washington DC and Massachusetts, and the Republicans are going to win Wyoming and Mississippi. If the goal is to nominate a candidate who can prevent a dystopian Trump presidency, Clinton’s win in Alabama and Sanders’s win in Vermont are irrelevant. The primary results we should pay attention to are those from states that could determine the election outcome. Fare more important are the close results in Iowa and Nevada, Sanders’s victory in Colorado, and Clinton’s in Virginia.
So, the other thing you could include in your allocation factor is a measure of “swinginess”. There are a lot of ways you could do this, but here’s a simple one: calculate the mean and standard error of the difference between Republican and Democratic vote percentages in each state over the past three elections. Assuming those values are Normally distributed, calculate the probability that the winner is different from what we expect from the mean. So, if the mean difference is exactly 0%, the probability would be 0.5. If the mean difference is 5%, and the standard deviation is also 5%, the probability would be about 0.17. If the mean difference is 30%, and the standard deviation is 5%, the probability is effectively zero.
Take this probability and multiply it by the number of electoral votes. The result is something like the number of electoral votes you can expect to get by doing well in that state.
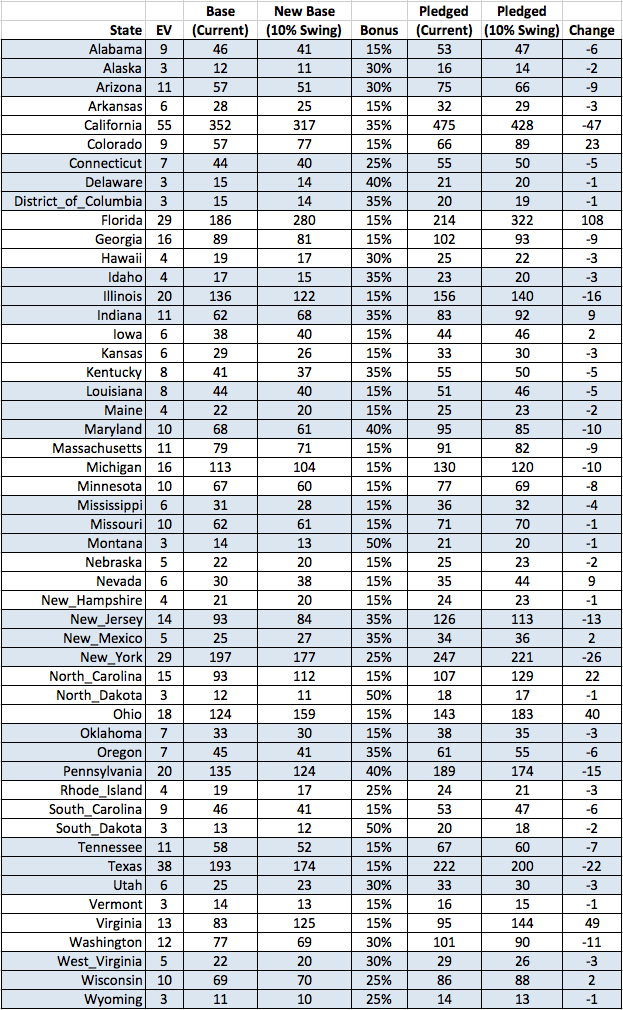
What remains, then, is how to combine this factor with the other considerations. For example, if we use an Allocation Value that is 90% the existing formula, and 10% Swinginess, we get the following:
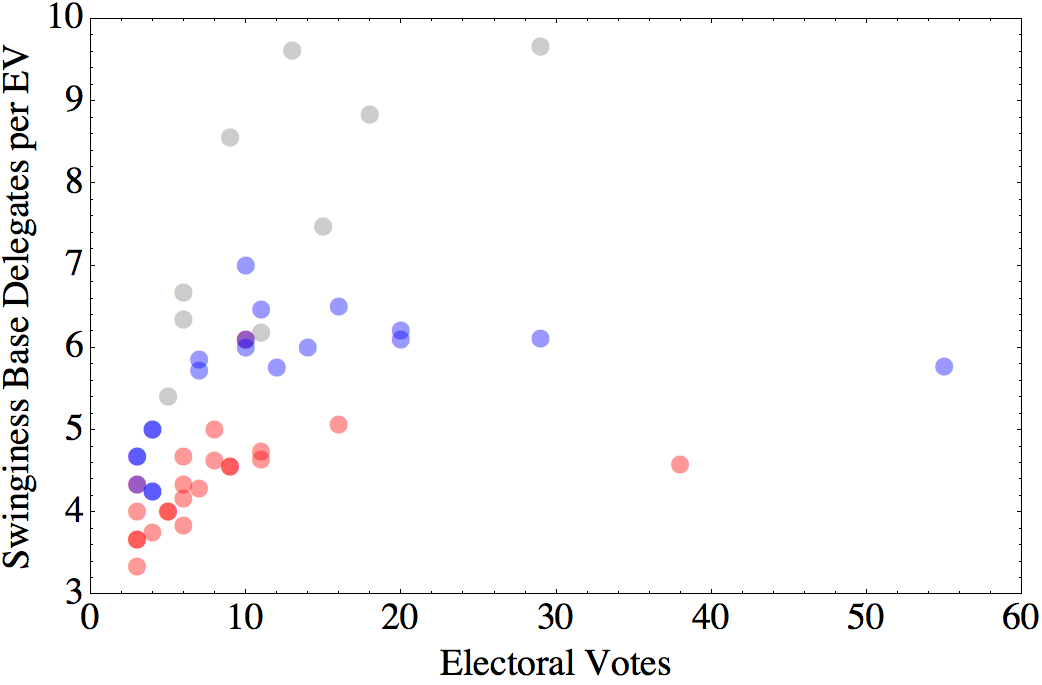
If we use these numbers to replot our graph of base delegates per electoral vote versus electoral votes, you can see how the states that have been close in the past get bumped up.
Those four highest points, from left to right, are Colorado, Virginia, Ohio, and Florida.
Is this fair? I’m not actually sure what that means in this context. Keep in mind that nearly 1/3 of the delegates exist either a) to directly express the will of the party elite, or b) to allow the national party to manipulate how and when the states hold their primaries.
A better question might be, would it work? Also, what other consequences might result? It seems intuitive that, for the Presidential election itself, a candidate’s ability to carry Ohio is more important than how much of a landslide they could rack up in California. On the other hand, winning by more (or losing by less) in non-competitive states could make a difference in down-ticket races. And if you discount the voters in solid-blue states too much, you risk alienating your base.
All in all, I suspect something along these lines would be an improvement. At a minimum, it might be a useful way to factor in “electability”, particularly in election years that are more likely to be decided by base turnout than by swaying independent voters.


