Last Thursday, Donald Trump gave a 95-minute speech in Iowa that was variously characterized as “unhinged” (by most people) or “a liberal conspiracy” (by Trump supporters). A significant portion of the speech was devoted to Ben Carson, who had recently overtaken Trump in Iowa polling. As part of his rant, Trump asked, “How stupid are the people of Iowa?”
On Friday, the Washington Post published an informal analysis of the relative intelligence of different states. In answer to Trump’s question:
Well, we can answer that. Not stupid at all. In fact, Iowa is one of the smartest states in America.
This is necessarily hard to figure out, of course, given that “stupid” is inherently contextual and subjective. In order to figure out how smart each state was, we looked at objective measures we had at our disposal.
. . .
The results? Iowa is the eighth-smartest state, behind, in order: Massachusetts, Minnesota, New Hampshire, Connecticut, Wisconsin, Kansas and Vermont. Donald Trump’s home state of New York came in 17th. The bottom five states were Florida, Alabama, Mississippi, Nevada and, in the 50th spot, Hawaii.
The Washington Post analysis combines four metrics: mean IQ score, mean SAT score, mean ACT score, and percentage of college grads. Each of these was converted to a percentage difference from the national median. They were then combined, with IQ being given twice the weight of the other three metrics.
Now, there are a lot of caveats here, which the Post is aware of, and there are certain tweaks one might make. (For example, I might favor Z-scores over percentage difference from the median. Plus, there’s the conflation of intelligence and education, the confounding of those concepts with social and economic opportunity, etc., etc.) But, most of those probably don’t qualitatively change the conclusions of the analysis, and I’m not going to worry about them here.
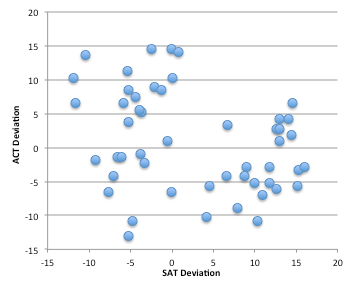
However, there is something striking when you look at the metrics themselves. There seems to be a trend where states with positive SAT deviations (average SAT scores above the national median) have negative ACT deviations. For example, Alabama has an ACT deviation of -10.3, but an SAT deviation of +4.3. Maine’s deviations are +13.6 on the ACT and -10.4 on the SAT. Massachusetts has a +14.6 on the ACT, but a -0.1 on the SAT. In fact, the correlation between ACT deviations and SAT deviations across all 50 states is r=-0.31. So what the heck is going on?
Well, as it turns out, the variation in mean test score from state to state is determined almost entirely by test participation. The larger the percentage of kids who take a test, the lower the average test score. That’s presumably because, if 10% of the students in your state take the SAT, it’s not a random 10%. It is the most highly motivated students who are trying to beef up their college applications.
Here are the relationships between participation rate and test score in the data used by the Washington Post (found here and here):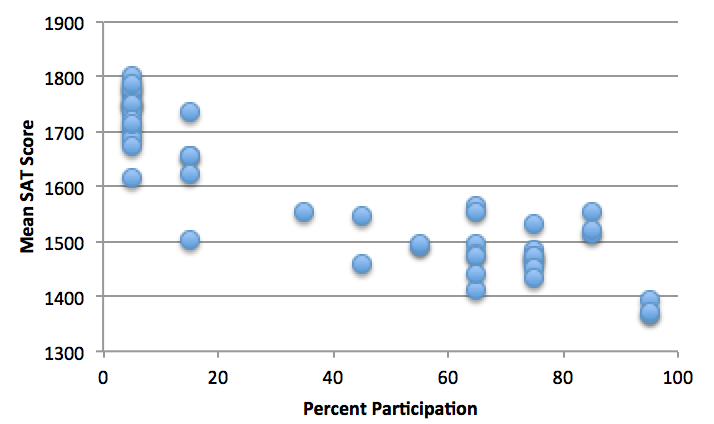
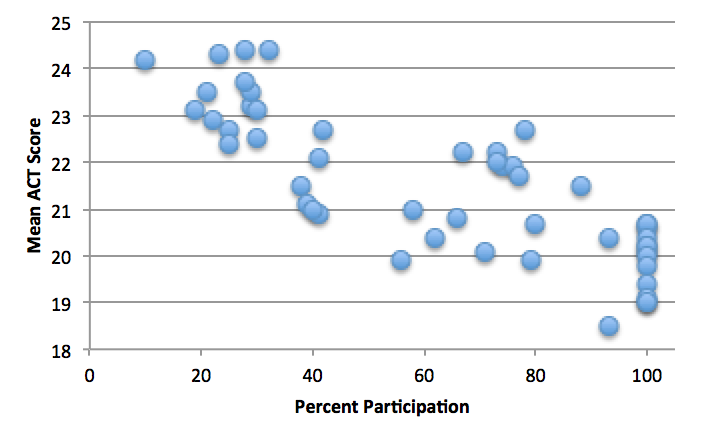
The correlations are r = –0.90 for the SAT and r = –0.81 for the ACT. That means that the vast majority of the variation in test scores from state to state is accounted for by differences in participation.
So, one simple thing to do is to fit a line through each of these distributions. Then, we can use that line to estimate what the mean test score would have been for each state if 100% of the students had taken the test.
First off, after we make this correction, it turns out that the mean ACT and SAT scores in a state are positively correlated (r=0.73). So that makes it seem more plausible that we are looking at two different measures of the same underlying trait (“intelligence” combined with various cultural and economic factors).
Then, using the same formulation as the Post’s original ranking, we get this:
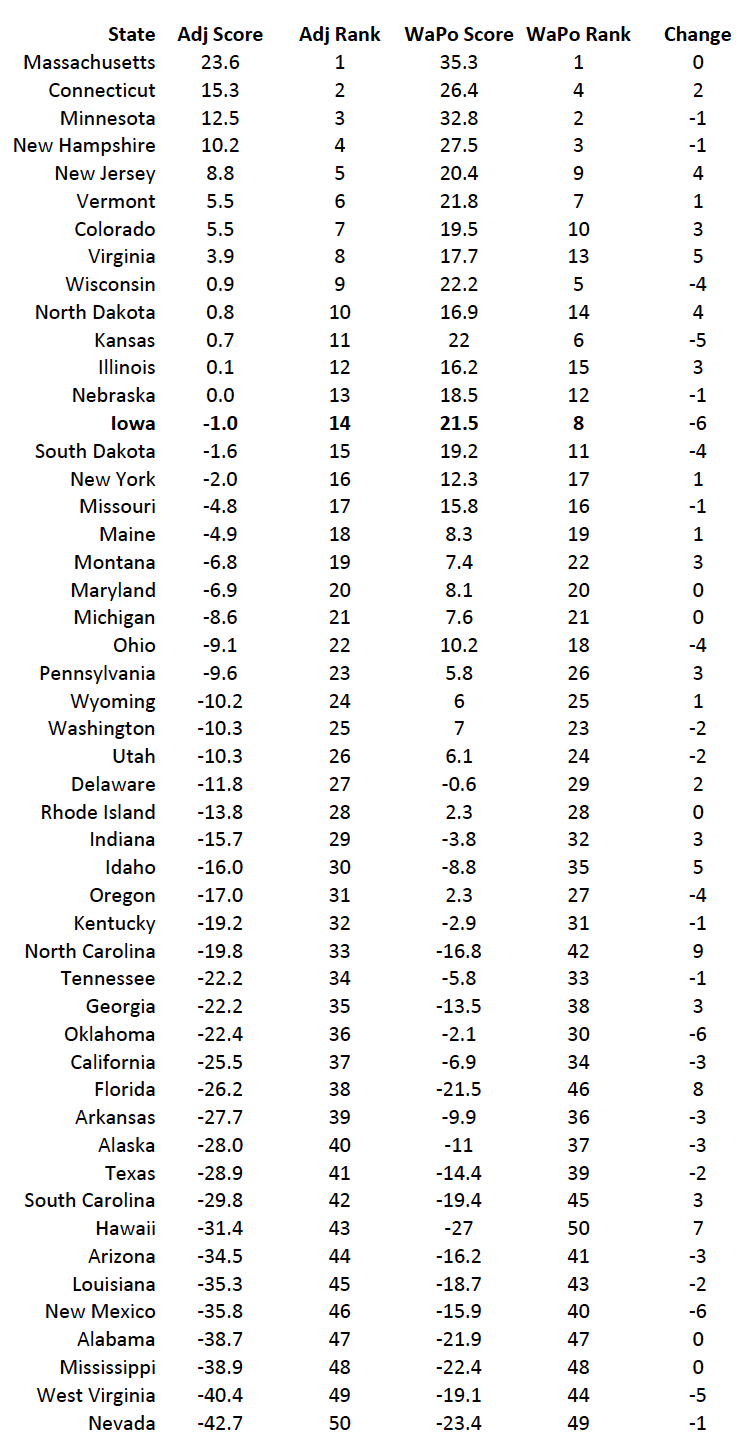
The “Change” column indicates how many positions up or down a state moves in the rankings after making this adjustment for test participation.
Iowa moves down six spots from #8 to #14, but is still above the average, and still above New York. Other big losers are Oklahoma and New Mexico, both of which also move down six spots.
The biggest winners are North Carolina (+9), Florida (+8), and Hawaii (+7).
So why the shifts? In general, there are SAT states and ACT states. That is, in most states have very high participation in one of the tests and very low participation in the other. North Dakota is an ACT state, with 100% participation in the ACT, but less than 10% in the SAT. Maine is an SAT state, with >90% SAT participation, but only 10% ACT participation. In states like these, the two corrections tend to balance each other out.
The states that move down most dramatically when we make the correction are those that have low participation in one test, but only modest participation in the other. For example, Iowa has <10% SAT participation, but only 67% ACT participation. So, 25-35% of the students in Iowa took neither test. What this analysis suggests is that if they had taken one of the tests, they probably would have brought Iowa’s average scores down.
Conversely, the states that move up are those where a significant fraction of students take both tests. In North Carolina, which jumped from 42nd to 33rd, 100% of students took the ACT, and 60-70% of them also took the SAT.
But note that none of this undermines the central take-home message of the Post’s analysis: Donald Trump is a goddamn moron.