Category Archives: population genetics

12,000-Year-Old Underwater Skeleton and the Peopling of the Americas

So, a paper published in Science yesterday describes the analysis of the skull and mitochondrial DNA of a skeleton discovered in Hoyo Negro, a water-filled cave beneath the surface of the Yucatán Peninsula.  In addition to the human skeleton (whom the scientists named “Naia” before removing her head for further study), the cave contains the remains of 26 other large mammals, including a saber-tooth tiger and some sort of a mammoth-type thing.

Check out the story over at National Geographic for some cool underwater pictures.

There are a couple of things that make this an interesting story. First of all, it’s a freaking underwater cave with a 12,000-year-old human skeleton and a saber-tooth tiger. Second, it adds an interesting piece of data to our understanding of how people first came to America. (Spoiler: the answer is not “Jesus brought them on the Ark”.)

The standard story of the colonization of the Americas goes something like this. Back during the last ice age(s), maybe 15,000 to 25,000 years ago, the sea levels were lower, and there was a land bridge connecting Siberia to Alaska. During that period, people from Northeastern Asia crossed over and spread throughout North and South America. Thousands of years later, their descendants had the misfortune of being discovered by the Europeans.

The dates of archaeological sites throughout the hemisphere generally fit with this story, as do genetic data collected from contemporary Native Americans and from skeletal remains. Native Americans, both past and present, are genetically most closely related to the peoples of Siberia, and the genetic divergence between the two groups is consistent with the populations having separated around the time when the land bridge existed.

The problem is that when you look at skull shapes (“cranio-facial morphology”), they seem to tell a different story.  Contemporary Native Americans have facial features similar to those found in Northeastern Asia. But “Paleoamericans” (dating from more than about 9,000 years ago) have features more closely resembling those found in African and Southeast Asian populations.

Those features suggest a different story, one where humans arrived in America in two waves. In this scenario, the humans who crossed the Bering land bridge would be the second wave, perhaps displacing the original, first-wave settlers. This is a story that entered the public consciousness more than fifteen years ago, following the discovery of “Kennewick Man”, who was described as possessing “caucasoid” features by James Chatters, who is also the first author on this paper. A certain strain of “thinker” took this to mean that the White people who came to America were not colonizers, but liberators, having been the continent’s original inhabitants.

The single-wave model suggests the possibility that the difference in skull morphology observed between earlier and later Paleoamericans represents evolutionary change that occurred after the migration across the land bridge. At first blush, this seems a bit questionable, since it would have the American population evolving to more closely resemble their genetic relatives in Asia, but only after having become geographically separated from those relatives.

The persistence of this controversy is due, in part, to the fact that the genetic data has generally come from different sources than the morphological data. This is where Naia comes in. Naia has the longer, more slender, Africa-esque cranium found in other early sites, but her mitochondrial DNA haplotype is a typical Native American one. This seems to support the idea that the people who left these narrow skulls all over America and the people who left their descendants all over America were the same people.

The biggest caveat, of course, is that this is a single skeleton. It is exciting and informative, since very few samples of this age have been discovered, and none of them have been of this quality. But those small numbers also mean that anything we discover about this skeleton is bound to be consistent with multiple stories, and things are unlikely to be resolved without a lot more data.

The other caveat is that the mitochondrial DNA is only one piece of the genetic history. It is possible that these really were two separate populations, and that Naia just happened to have some second-wave ancestors on her mother’s side. If we were to examine the rest of her genome, we might find some or all of it to be more similar to some other population (like the lost thirteenth tribe, who immigrated to America from Israel and/or Kobol).

Will we get the rest of Naia’s genome? I hope so, but we’ll see. It is relatively easy to collect mitochondrial DNA from archaeological samples, since there are hundreds of copies of the small, circular mitochondrial chromosome in each cell. There are only two copies per cell of the rest of the genes, which reside in the cell’s nucleus. So, it is possible that the sample was sufficiently well preserved that mitochondrial DNA could be extracted, but degraded enough that the nuclear DNA is not recoverable.

Whatever the eventual conclusion, the story will be interesting. Either the peopling of America involved a mixture of multiple populations that will be fun to unravel, or it involved some interesting, almost convergent, morphological evolution. Stay tuned!

Two more from Fisher and Haldane

So, previously I introduced you to Darwin Eats Cake’s two newest characters, R. A. Fisher’s Pipe and J. B. S. Haldane’s Mustache. Well, the comedy duo have provided two more installations of their series, tentatively entitled, “Stuff Sitting in Jars on a Shelf, Talking.”

I would not necessarily have predicted this, but as it turns out, Fisher’s Pipe has a really juvenile sense of humor.

It’s sort of sad, really.

Best URL for sharing: http://www.darwineatscake.com/?id=151
Permanent image URL for hotlinking or embedding: http://www.darwineatscake.com/img/comic/151.png
Best URL for sharing: http://www.darwineatscake.com/?id=152
Permanent image URL for hotlinking or embedding: http://www.darwineatscake.com/img/comic/152.png

2012 Gift Guide for Population Geneticists

So, it’s that time of year again, when you have to come up with gift ideas for the population geneticist in your life. Personally, I like cash, but if you insist on coming up with personalized gifts, here are some ideas for you:

1. Mathematical Population Genetics, by Warren Ewens

This book was originally published in 1979. When I was in grad school, it had been out of print for years. People would pass around xeroxed copies that had been made from other xeroxed copies.

Finally, a couple of years ago, the second edition came out. So now the population geneticist in your life can own their very own book-shaped copy.

Of course, it’s a little bit pricey. Fortunately, there are plenty of other gifts on this list for the folks about whom you don’t care enough to buy this book. 🙁

2. The Gospel of the Flying Spaghetti Monster, by Bobby Henderson

Okay, cheapskate, maybe this is a little bit more your speed. This is the perfect gift for the pastafarian population geneticist.

Or it could be a good evangelical gift for those who have not yet been touched by his noodly appendage.

And look, it comes with one of those little ribbon things that means you don’t have to use your wadded up Starbucks receipt as a bookmark!

3. Gene Pool Shirt

Get it?

It’s a jean shirt!

With a pool ball on it!

Great conversation starter!

Also comes in Flaming 8-Ball!

4. Obnoxious Car Decals

There are a number of different aggressively obnoxious things that you can get for your car, like a T-Rex eating a Jesus fish. But if your goal in life is to get your headlights smashed by some nice religious folk, nothing will beat this “Procreation Car Emblem.”

If you’re in the mood for something a little more subtle, there are some good options in the “Customers who bought this item also bought” section.

5. Remarkable, by Lizzie Foley

Okay, okay, I know what you’re thinking. That this is shameless promotion of my wife’s book, and has nothing to do with population genetics.

Yes, fine, it’s shameless, but it’s a great book, perfect for the population geneticist with one or more F1s a home (ages 8 and up!). And it does feature a cameo appearance by population geneticist and UCLA Professor John Novembre. For reals!

Also, the story features boy and girl identical twins. So, analyze that.

6. DNA Earrings

What’s that?

I can’t hear you.

I’ve got DNA in my ear.

7. DNA Portraits

Okay, check this out. You send in a swab of DNA, and $199, and they’ll send you a giant picture of a gel, which is I guess is supposed to be some fraction of your genome? Maybe? It looks like there are supposed to be eight sample lanes, and it’s that old-school sequencing analysis where each dideoxynucleotide terminator gets its own lane. So this might be about forty bases of sequence. Maybe?

To be honest, though, this looks a lot more like a protein gel to me. Maybe they use your DNA, clone a little tiny homunculus of you, grind it up, trypsin digest it, and this is that gel.

If that wasn’t bad enough, you also have the option of getting your DNA made into a giant QR code poster (that no one will ever scan).

For the money, I’d go with two copies of the Ewens book.

8. Personalized Genetic Analysis

The classic here is 23 and Me.

Okay, maybe you’re thinking, no, a real population geneticist would not want one of these goofy personalized genetic analysis things. Those are for amateurs, mere heredity enthusiasts. Will my population geneticist friend be offended by the ridiculous pinpointing of their Y-chromosome and mitochondrial ancestry, or the ridiculous breakdown of racial composition, or the ridiculous risk-factor analysis?

Well, that’s the beauty of this gift. If they are the wild-eyed, naive sort of population geneticist, they’re just going to be so gosh-darned excited to get all that cool information. If they’re the bitter, cynical sort of population geneticist (most of them, in my experience), you’ll be giving them the gift of feeling knowledgable and superior!

If you want to surprise them, order the kit and swab their cheek while they’re sleeping.

If you really want to surprise them, order a second kit, swab a random guy, get the results, and claim that the results are from their father.

9. Darwin Eats Cake Stuff

Yeah, you thought plugging my wife’s book was shameless? I’ll show you shameless! Check out these new items from the official Darwin Eats Cake store:

Look! It’s a mug illustrating the academic funding cycle: papers->money->caffeine->papers.
Also works for non-population-geneticist academic types.

Look! It’s a trucker hat featuring Guillaume the Adaptationist Goat’s credo!

Look! It’s a t-shirt featuring J B S Haldane’s moustache in a jar!

Don’t see anything you like? You can check out the comics and contact the “artist” here to submit special requests.

10. Ronald Reagan Riding a Velociraptor with a Machine Gun

Okay, so this one really has nothing to do with population genetics, but it is 100% pure awesome.

Prints available in 11×17 or 24×36 from SharpWriter at deviantART.

Other ideas? Leave them in the comments.

Two new characters at Darwin Eats Cake

So, if you’re a regular reader of Darwin Eats Cake, you’ll already know that two new characters have been introduced to the strip: R A Fisher’s Pipe and J B S Haldane’s Moustache.

If you’re not a regular reader, you should be, because it will make me happy (and it is, after all, the holiday season), and also because Robert Gonzales once called it “my [meaning Robert’s] new favorite webcomic” over at io9.

For those of you who are not population geneticists, or at least evolutionary biologists, Fisher and Haldane are two of the major figures of the “modern synthesis” in evolution in the first part of the twentieth century. This was basically the integration of the Mendelian idea of the gene with the Darwinian idea of gradual change via natural selection. Fisher, in addition, created a whole lot of modern statistics, which have found applications far outside of evolutionary biology.

R. A. Fisher smoking his pipe. Not a euphemism.
J. B. S. Haldane, um, I guess, having his mustache. Note the lack of “o” in the American spelling of mustache.

Fisher loved himself a good smoke. In fact, late in his life, he publicly challenged research purporting to show a causal link between smoking and lung cancer. Oops.

Haldane once chased my former officemate and his mother down the street in a rainstorm in Calcutta to offer them an umbrella.

These two anecdotes provide all the information you need to accurately reconstruct the political views of each.

Fisher passed away in 1962, and Haldane in 1964. Fortunately, one of the most salient features of each was preserved in a jar for posterity. And now, half a century later, the two have reunited to bring you their genetically inspired comedy stylings.

Here’s what you’ve missed so far:

Best URL for sharing: http://www.darwineatscake.com/?id=143
Permanent image URL for hotlinking or embedding: http://www.darwineatscake.com/img/comic/143.png
Best URL for sharing: http://www.darwineatscake.com/?id=145
Permanent image URL for hotlinking or embedding: http://www.darwineatscake.com/img/comic/145.png
Best URL for sharing: http://www.darwineatscake.com/?id=148
Permanent image URL for hotlinking or embedding: http://www.darwineatscake.com/img/comic/148.png

Blue-eyed-people-are-all-related zombie news

So, you know how sometimes at night you’re lying in bed when you burp, but then the burp turns out to actually be you throwing up into your mouth just a little bit, and it tastes like a combination of whatever you ate for dinner and evil? Well, this is sort of like that.

Four years ago, a group of researchers from the University of Copenhagen published a nice paper on the genetics of blue eye color. In that paper they look at a bunch of Danish families in which some people have blue eyes and some have brown eyes (or, combination blue-brown eyes, which, for purposes of this study, are treated as non-blue). They also look at a small sample of non-Danish blue-eyed folks: five from Turkey and two from Jordan.

The paper makes a compelling case that the pure blue eyes phenotype depends on a particular nucleotide substitution that alters regulation of the gene OCA2. Furthermore, there is an extended haplotype around the key mutation that is shared by everyone in their sample (a few people have additional nucleotide substitutions that most likely post-date the key functional mutation). This suggests that, while there are many genes that contribute to eye color variation and to pigmentation in general, there may be a single critical mutation responsible for all of the blue eyes out there. Which is pretty cool.

For reasons that I still don’t understand, this study has popped back into the news recently. In particular, an article that looks to have been written back in 2008 in USA Today was “updated” in February, and has resurfaced on AOL, which describes it as a “study from USA Today,” and warns people with blue eyes about the dangers of falling in love with another blue-eyed beauty. Presumably because of incest (also shown is a clip from HLN — the artist formerly known as CNN Headline News — featuring the anchor doing a whole “ick” thing).

In worst-of-media-coverage-of-science fashion the reports that I have found (both from 2008 and from 2012), coverage focuses on stuff from the paper that is tangential, irrelevant, or wrong.

First, “all blue-eyed people are related.” Where to start. The researchers suggest that the mutation might have arisen 6000-10000 years ago in the Black Sea region, prior to the Neolithic agricultural expansion into Europe. If we assume a generation time of, say, 25 years, that is 240-400 generations. If we look back that far in the past, even just to the 6000 year mark, each of us has 2^240 ancestors. That’s 1.7 x 10^72, which, you will notice, is not just much larger than 7 x 10^9 (the current population of the whole world), but is close to the ballpark of the total number of atoms in the universe.

The fact is, once you go back more than a few hundred years, each of us has a list of ancestors that features the same people over and over again. Not only are we all related, we are all related over and over and over again. While your brother may not be your cousin, your tenth cousin is quite likely to be your seventh cousin as well.

So, yes, all blue-eyed people are related, but there is not really anything here to suggest that they are significantly more closely related than any two people.

Second, both the 6000-10000 year timeframe and the Black Sea origin of the mutation — both of which featured heavily in press coverage of the paper — are completely unsupported by anything in the data. What the authors actually say is this:

The mutations responsible for the blue eye color most likely originate from the neareast area or northwest part of the Black Sea region, where the great agriculture migration to the northern part of Europe took place in the Neolithic periods about 6–10,000 years ago (Cavalli-Sforza et al.1994).

The high frequency of blue-eyed individuals in the Scandinavia and Baltic areas indicates a positive selection for this phenotype (Cavalli-Sforza et al. 1994; Myant et al. 1997). Several theories has been suggested to explain the evolutionary selection for pigmentation traits which include UV expositor causing skin cancer, vitamin D deficiency, and also sexual selection has been mentioned. Natural selection as suggested here makes it difficult to calculate the age of the mutation.

That is, we don’t know how old the mutation is, and have not tried to perform any sort of analysis to ask the question. That’s fine, because what the paper actually does is provide us with a basis for asking these sorts of questions, although that will require more extensive sampling.

The supposition here is based solely on the fact that there was this expansion of agriculture (along with, to a not-fully-characterized extent, an expansion of the genes of the people who developed that early agricultural technology), and that stuff in Europe probably came with that.

The actual way to ask the question would be to go and sequence the DNA of a bunch of folks from all across Europe. To first approximation, we might assume that the mutation first arose in the region where the blue-eyes haplotype shows the greatest within-haplotype genetic diversity. For example, if the mutation first arose near the Black Sea, we should see more genetic variation right around the key mutation among blue-eyed people near the Black Sea. If the allele arrived more recently in Sweden, blue-eyed Swedes would be more genetically similar to each other in the same genomic region, simply because there would have been less time for differences to accumulate.

All else being equal, we might expect the geographical origin of a particular mutation to be at the central point of its range, or near the place where the mutation has reached its highest frequency. That supposition would place the origin somewhere near the Baltic (rather than the Black) Sea. But, there is good reason to believe that this mutation may have been subject to selection. The blue-eyes allele also affects other aspects of pigmentation, and lighter coloring is thought to have been favored at higher latitudes due to the reduced incidence of sunlight.

The fact that we think that natural selection would have pushed the mutation northward means that that its origin was probably somewhere to the South of its current center. Exactly how far depends on a bunch of details, like the strength of selection, and how that strength of selection changes as you move from South to North.

The problem is that, to do it right, you would have to build a model that explicitly incorporates the agricultural expansion and natural selection acting on OCA2, with the strength of selection favoring lighter pigmentation depending on latitude. Maybe also the fact that there are other genes affecting pigmentation. It is something that is doable, especially now that we have a specific gene to focus on, but at this point what we have is a bunch of speculation.

So, to recap, 1) Cool paper. 2) Sex between blue-eyed people is not incest. 3) We have no idea when or where this mutation came from, but it is now conceivable that we could ask the question. 4) Embarrassingly bad science reporting spontaneously rises from the grave four years later and tries to eat your brain.

Eiberg, H., Troelsen, J., Nielsen, M., Mikkelsen, A., Mengel-From, J., Kjaer, K., & Hansen, L. (2008). Blue eye color in humans may be caused by a perfectly associated founder mutation in a regulatory element located within the HERC2 gene inhibiting OCA2 expression Human Genetics, 123 (2), 177-187 DOI: 10.1007/s00439-007-0460-x

The Genetical Book Review: The Postmortal

So, welcome to the first Genetical Book Review of 2012, where we’re going to talk about The Postmortal, by Drew Magary. As the book starts, Science!™ has developed a cure for aging, so that people can live forever. What follows is an exploration of the psychological and sociological consequences of immortality.

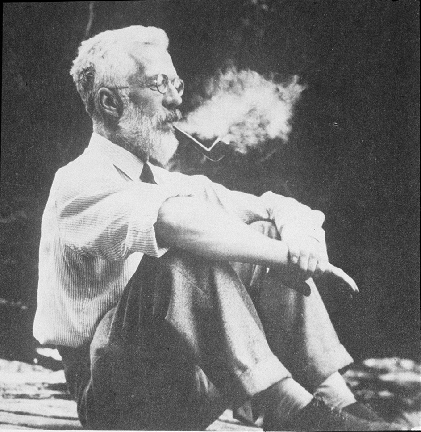
I love this picture. You can almost hear Death going, “D’oh.”

I don’t think I’m giving anything away when I tell you that the book winds up being predominantly dystopian. Basically, if you are the sort of person who frets about the future of humanity, who is prone to think things like, “How could I possibly bring a child into this world,” well, don’t read this book. At least, don’t read it in bed after a spicy take-out meal.

If you do enjoy the occasional sci-fi dystopia, this one is of the variety where you make only a small technological (or, in this case, medical) change, and explore the implications in a world that is otherwise very much like our own. One of the interesting things that the author gets to do with this particular premise is to follow history over many decades through the eyes of a single, first-person narrator. So, the protagonist experiences technological and societal changes that would normally take place over the course of generations.

The book is presented as a series of blog posts, some of which are personal, narrative entries, and some transcripts of news reports, others link roundups, and so on. Magary is a contributing editor at Deadspin, and his reporting / media background shows through in the writing. The whole book is engaging, but the writing really shines in the news bits, which are pitch-perfect.

In the book, the cure for aging is achieved through gene therapy, targeted at a single locus, which seems to be closely linked to MC1R, the gene most commonly responsible for redheadedness. What we’re going to use this as a jumping-off point to talk about different evolutionary theories of aging, and the extent to which each might be consistent with the existence of a single gene serving as a master control over the aging process.

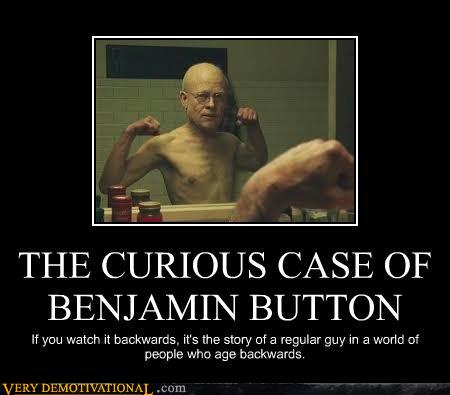
In The Postmortal, the cure for aging is discovered serendipitously as a byproduct of research aimed at changing hair color. In our actual dystopia, it would have gone differently. Benjamin Button would have been indefinitely detained under NDAA and selectively bred with normal humans. A series of backcrosses would have been used to isolate the gene responsible for his aging reversal. 

But first, a couple of quibbles.

Quibble number 1. There are two biologists who feature prominently in the book: father and son Graham and Steven Otto. Now, I’m not going to argue sexism on the basis of a sample of two, since, even in a world with full gender equality, a random sample of two scientists would both be male about 1/4 of the time (p = 0.25). However, Graham Otto’s devoted wife (and Steven Otto’s loving mother) is (apparent) non-scientist Sarah Otto. It just so happens (presumably unbeknownst to Magary) that there is a real-life Sarah Otto, a prominent biologist who was just awarded a Macarthur “genius” grant. So, that’s . . . unfortunate.

Quibble number 2. The “cure for aging” as presented in the book arrests an individual at whatever age they are when they receive the cure, whether it is three or eighty-three. This actually conflates two different processes: development and senescence. My biological intuition is that, even in the simplest conceivable case, there would be at least two distinct master switches controlling these very different processes. (Actually, possibly a third switch as well, controlling puberty and the onset of secondary sexual characteristics, as distinct from growth to adult size and shape.)

In talking about evolutionary theories of “aging,” I will focus on evolutionary theories of senescence, which is really the most important aspect of “aging” with respect to this book.

[Note: none of this should be interpreted as a criticism of the premise or execution of the book, which I loved. The inherent power of science fiction comes from the idea that you build a world that differs from our own. Rather, as always with The Genetical Book Review, the book’s premise serves as an excuse and a specific context for talking about evolution.]

Basically, there are three major classes of ideas about the evolutionary origins of senescence, which have different implications for how much and how easily natural selection or medical intervention might be able to extend our lifespans. As is often the case, these different theories are not necessarily mutually exclusive or incompatible, but rather have different emphases. Most consistent with the premise of the book are theories that propose a positive adaptive value to senescence and mortality. Somewhat less consistent are theories that focus on senescence as a byproduct of the fact that natural selection becomes weaker for traits that are expressed later in life. Least consistent are theories suggesting that senescence and lifespan are profoundly constrained by biological universals. We’ll take each of these in turn.

Just as youth is wasted on the young, discounts are wasted on the elderly.

1) Senescence as an adaptation.

The idea that there could be a single genetic master switch controlling senescence is most plausible under models where aging and death are specifically adaptive. How would that work, you ask. I mean, after all, the whole idea behind natural selection is that is favors surviving and reproducing, right? Well, in some models, you can actually identify conditions where it makes sense beyond a certain age for adults to go ahead and die. One particular model (cited below) describes an adaptive benefit (at the group / inclusive fitness level) to senescence from limiting the spread of disease.

Perhaps somewhat more generally applicable are models in which senescence is selectively favored as part of a trade off. The idea is that it would be possible to construct a human who lived to be, say, 150, but that it could only be achieved through some sort of compensatory change in another trait. Candidate examples would be size or reproductive output. In fact, all else being equal, smaller humans do tend to live longer than larger ones. Similarly, there are a handful of studies purporting to show that abstaining from reproduction extends lifespan.

In this sort of case, it is easy to see how natural selection might actually favor earlier senescence. To first order, what matters to evolution is how many offspring you produce. If you can grow big and have lots of kids, you’re going to win the evolutionary race, even if it means that you drop dead of a heart attack at thirty-five.

Under one of these models, it is easy to imagine the existence of one or a few genes that function as controllers, or strong modifiers, of senescence. Under the strongest version, you can even imagine a gene affecting only senescence. Under the weaker, trade-off version, it might be possible to dramatically extend lifespan, but not without side effects. Maybe the immortals would all weigh eighty pounds and have dramatically – or indefinitely – delayed onset of reproductive capacity.

In a world dominated by evolutionary trade-offs, the immortals will all be Romanian.

2) Senescence as the absence of selection.

Imagine one trait that affects the probability that you survive to age ten. Now imagine a second trait that affects the probability that you survive from ten to twenty. Whatever selection is acting on the second trait, it has to be weaker than what is acting on the first one. The reason is that the second trait is under selection only in that subset of the population that survives to be ten.

This argument, of course, blends into the trade-off argument introduced earlier. We can imagine traits that trade off health (and survival) at later ages in exchange for enhanced health at earlier ages. In general, such traits will tend to be favored. Basically, it doesn’t matter how robust you are at eighty if you die at twenty.

Even without such tradeoffs, however, we expect to see natural selection growing weaker with age. Given any rate of death (due to choking on litchi nuts, falling off cliffs, being eaten by tigers, whatever), there will be more people alive at age x than at age x + y, for any y > 0. So, the older you are, the less power natural selection has to fight against entropy – both the familiar entropy of the physical world and the evolutionary entropy of the mutation process.

Some of the evidence in support of this idea comes from the fact that there are certain species that tend to live longer than expected. Included among these are birds, porcupines, and humans. What do those have in common? The reason in each case is different, but each has a reduced rate of predation. If you reduce the death rate, you increase the power of selection to slow down the aging process.

One consequence of this is that we expect all of the different systems that make up our bodies to fail at similar rates. For instance, if the human heart just gives out after 100 years, any and all selection goes away for maintaining anything else (brain, kidneys, liver, etc.) for longer than that. This perspective suggests that there will not be a single tweak that could stop aging. Rather, it would require a whole bunch of tweaks, or maybe something more like a Never-Let-Me-Go-style organ harvesting scheme.

3) Senescence as a fundamental constraint.

These ideas come from the existence of certain universal scaling laws, regularities in the relationship between features like body mass, metabolic rate, and lifespan. There are a lot of ideas out there, but what, exactly, is driving these relationships is not yet understood. However, the relationships themselves seems to be fairly robust.

One of the striking findings in this area is the fact that, among species with a heart, an individual’s lifespan corresponds to about 1.5 billion heartbeats. Small species have fast metabolic rates, fast heartbeats, and short lives. Large species live slower and longer.

Once again, these ideas are not mutually exclusive with the “rates of predation” idea. In fact, when we say that species like birds and humans live “longer than expected,” these scaling relationships determine what “expected” is. For instance, a human with a heartrate of 72 beats per minute might live to have about 3 billion heartbeats.

Whatever the origin of these patterns, their apparent universality suggests the existence of very deep constraints on our biology. While natural selection (or medicine) might be able to alter our lifespans, it may be that such intervention is limited to relatively small changes, maybe a factor of two. Perhaps something human sized that could live for many hundreds of years would have to be based on a fundamentally different biological architecture.

Following the 2012 Mayan-Zombie/Santorum-Paul apocalypse, humans and other land-based vertebrates will become extinct. Eventually, cephalopod-based land dwellers will eventually emerge to fill our vacated ecological niche.
Perhaps they will live longer. Image via Chowgood’s Deviant Art page.

So, overall, I think the likelihood of a single medical advance that dramatically increases our natural lifespans is pretty remote. But, as you’ll see if you read the book, that might be for the best.

Here are just a few references to get you started if you are interested in the evolutionary constraints on lifespan and senescence.

Glazier, D. (2008). Effects of metabolic level on the body size scaling of metabolic rate in birds and mammals Proceedings of the Royal Society B: Biological Sciences, 275 (1641), 1405-1410 DOI: 10.1098/rspb.2008.0118

Mitteldorf J, & Pepper J (2009). Senescence as an adaptation to limit the spread of disease. Journal of theoretical biology, 260 (2), 186-95 PMID: 19481552

Williams, G. C. (1957). Pleiotropy, Natural Selection, and the Evolution of Senescence Evolution, 11 (4), 398-411

Well, that’s all for today! Check back again soon, as The Genetical Book Review will be posting more frequently in 2012.

Buy it now!!

What’s that? You say you want to buy this book? And you want to support Lost in Transcription at the same time? Well, for you, sir and/or madam, I present these links.

Buy The Postmortal now through:

Amazon

Barnes and Nobleicon

indiebound

Alibris

State-by-State FST(ish) Values: The Structure of Racial Diversity in America

So, in the world of population genetics, as in the real world, people are often interested in diversity, and in how that diversity is distributed. In biological contexts, quantifying these things is important because it gives us insight into the processes – like reproduction, migration, selection, etc. – responsible for generating the observed patterns of diversity.

Here I look at how racial diversity is apportioned among counties (or county equivalents) in each of the 50 states, using two different statistics derived from the population genetics and ecology literature. Hit the jump for the analysis, and scroll down to skip the introduction and go straight to the maps.


One of the earliest and most enduring quantities in population genetics is FST. This quantity (along with various closely related “F”s with different subscripts) is an attempt to create a metric of population differentiation that is independent of the overall level of diversity. There are a variety of ways of formulating FST, depending on the type of data you’re thinking about, but all are something like this:

FST = (Db – Dw) / Db

Here, FST is a measure of differentiation between or among subpopulations. Dw is the diversity within subpopulations, and Db is the diversity among subpopulations. As you can see, if you simply double the level of diversity (both within and among subpopulations), this measure of differentiation will be unchanged.

The concept of FST was developed 80-90 years ago, primarily by Sewall Wright, who examined and characterized some of its properties within highly simplified and idealized models of population structure. Then, 40-50 years ago, people started thinking about ways to estimate this quantity from genetic data. A lot of FST-related statistics have been developed, but I will described just one here, which compares the observed and expected levels of heterozygosity:

GST = 1 – HO/HE

HE is the observed level of heterozygosity. Roughly speaking, we look at some gene all of the individuals in the population. Each person has two copies of the gene. If the two copies are the identical, the person is homozygous; if they are different, the person is heterozygous. The observed heterozygosity simply the fraction of people who carry two different copies.

The expected heterozygosity, HE is calculated by taking all of the genes in the population and mixing them together. Now, draw two gene copies at random and ask, what is the probability that the two gene copies are different?

If the population is completely well mixed, HO and HE will be nearly the same, and GST will be close to zero. Elevated levels of GST result from non-random mating. For example, if the population consists of two isolated subpopulations, those subpopulations will tend to contain different versions of the gene, but there will be no one who has one copy of a variant from subpopulation 1 and a variant from subpopulation 2. Thus, there will be a reduced number of heterozygotes in the population, relative to what you would get if you mixed all of the genes in the two subpopulations together.

This notion of heterozygosity is not limited to genetic contexts, however, and we can do the equivalent calculation for any trait that can be divided into distinct categories (even if those categories are somewhat arbitrary social constructs like “race”).

Here’s an illustration. I have taken data from the 2009 American Community Survey, aggregated at the level of individual counties. I calculate the “observed heterozygosity” from the frequencies of different races in each county. Imagine that within each county, we paired people at random. The HO calculated here is the fraction of these randomly paired couples who would have mixed-race children. In this calculation, I have assumed that if one parent self-identifies as “two or more races,” the children are mixed race, independent of the race of the other parent. Also, for simplicity, I have aggregated all subdivisions of “hispanic” into a single category. The HE here is calculated from the same random-mating procedure applied at the level of the entire state.

Here is a map of the results, generated using the free, online map generator from the National Council of Teachers of Mathematics:

Darker colors correspond to higher values of GST.

Now, it has been known for a long time that FST is not particularly well behaved. It is sensitive to things like the total number of distinct gene variants in the population and the total number of subpopulations. Recently, researchers have begun developing corrections to estimators of FST that are more robust to these deviations from the ideal models originally studied by Wright. One such correction was published a couple of years ago by Lou Jost, who proposed a metric, D, which demonstrably has many desirable properties that we would like to see from a statistic that describes population differentiation. In terms of the heterozygosities that go into GST, D is calculated like this:

D = [(HE-HO)/(1-HO)][n/(n-1)]

where n is the number of subpopulations. We can recalculate the racial “population differentiation” at the county level for each state. The new map looks like this:

As in the previous map, darker colors represent higher values of D.

Now, there are a lot of reasons to exercise caution in interpreting these values. The Jost correction used to generate the second corrects for certain problems associated with GST, but there is still an issue in that this analysis is based on aggregation at the county level. The geographical extent of counties varies enormously from state to state; the meaning of being in the same county in Utah is quite different from being in the same county in New York. Furthermore, the frequencies and identities of the groups vary among states in a way that will matter much more to any sociological analysis than will the numbers presented here. The FST-related statistics used here have been developed in the context of biological data, with the goal of understanding biological processes that are not necessarily analogous to the social processes that have driven the distribution of various groups in the US.

On the other hand, it is a lot more fun NOT to exercise caution. To that end, here is your list of the ten most racially differentiated states based on Jost’s D (second map):

Maryland, Texas, New York, Florida, Alaska, Mississippi, Georgia, New Mexico, New Jersey, California

And the ten least differentiated:

Vermont, Maine, New Hampshire, West Virginia, Iowa, Wyoming, Utah, Delaware, Minnesota, Idaho

If we go back to the raw GST (first map) the top-ten most differentiated are:

South Dakota, Maryland, North Dakota, Tennessee, New York, Montana, Texas, Pennsylvania, Florida, Alaska

And the least:

Vermont, Maine, Delaware, New Hampshire, Hawaii, West Virginia, Connecticut, Nevada, Utah, Oregon

I will leave irresponsible speculation and stereotyping of the residents of different states as an exercise for the reader.

JOST, L. (2008). GST and its relatives do not measure differentiation
Molecular Ecology, 17 (18), 4015-4026 DOI: 10.1111/j.1365-294X.2008.03887.x

The Distribution of Dominance

So, as you have no doubt surmised from the title of this post, the cash-strapped Republican Party is going to start using their abundant frequent “flyer” points to pay their debts.

I’m kidding, of course. The GOP doesn’t pay its debts!

Actually, we’re going to talk about a paper just out in Genetics by Aneil Agarwal and Michael Whitlock. They provide a very thorough analysis of data on the fitness effects of homozygous and heterozygous gene deletions in yeast.

But let’s back up for a minute first.

The authors are interested in understanding the distribution of dominance, in the population-genetic sense. Traditionally, the dominance is represented by h, and the strength of selection by s. Usually, we define the fitness of the wild-type (hypothetically not carrying any mutations) as 1. Then, we consider the fitness effect of a mutation in a particular gene. In this case, we’re going to focus on deleterious, or harmful mutations, which reduce fitness. If an individual carries two copies of the deleterious mutation, they have a fitness of 1-s, so that small values of s mean weak selection, and large values of s mean strong selection. The dominance refers to the relative fitness of an individual carrying only one copy of the deleterious mutation. This heterozygous fitness is 1-hs. If h equals 1, the deleterious mutation is completely dominant, meaning that having one copy of it is just as bad as having two. If h equals 0, the deleterious mutation is completely recessive, and having one defective copy of the gene is just as good as having two functional copies.

So, what is a typical value of h? Does it depend on s? How much does it vary from gene to gene? The conventional wisdom is that most deleterious mutations are recessive. This is why you should not have children with close relatives. I carry a bunch of recessive mutations, as does my wife. As long as we have different ones, our son inherits a bunch of mutations – but only one copy of each – so they’re recessive in him as well. If we were closely related, we would carry many of the same mutations, and there would be a decent chance that our son would inherit two defective copies of the same gene, which could have various health consequences.

Charles Darwin and his first cousin Emma Wedgwood were married in 1839. 170 years later, they were portrayed by real-life-non-first-cousin couple Paul Bettany and Jennifer Connelly (not pictured).

However, population geneticists don’t care about things like this just because of the implications for human disease. Dominance has a major impact on the eventual fates of individual mutations, and can influence other evolutionary processes, like speciation. Often, in order to model some other process, we have to make some sort of assumption about the distribution of fitness effects of mutations. Traditionally, a researcher would pull this distribution out of his or her asc. This is one of the biggest contributions that this paper will make to the field. It provides a nice, empirically based distribution of dominance effects that can feed into other evolutionary studies.

The results also confirmed (with much greater confidence than was previously the case) the relationship between h and s which had been suggested by some previous studies. They find that larger values of s tend to go with smaller values of h. Consistent with the conventional wisdom about not marrying your cousin, strongly deleterious genes tend to be pretty recessive. More surprisingly, most mildly deleterious mutations had fairly high h values. In fact, the mean value of h over all deleterious mutations was 0.8 – quite dominant. However, when the average is weighted by the fitness effect s, it drops to 0.2.

The authors also point out that this negative relationship between h and s has implications for the evolution of dominance. This pattern is most consistent with theories in which dominance is shaped by indirect selection. For example, deleterious mutations might be recessive if the protein produced by the gene were selected for overexpression to enhance a metabolic pathway, or to buffer the performance of that pathway in certain environments. Then, loss of one copy of the gene encoding that protein might not have a major effect on function (half of too much being still enough). Alternatively, recessiveness could come from feedback mechanisms that upregulate the functional copy of the gene when not enough of the gene product is being made.

The point is that in either of these cases (among others), recessiveness is driven by selection to maintain the function of the gene. The more important the gene is (the larger the value of s associated with it), the stronger this selection will be, and the more recessive deleterious mutations will become. Therefore, mechanisms like these predict the observed negative relationship between h and s.

On a historical note, this type of buffering process was proposed by one of the giants of population genetics, J. B. S. Haldane way back in 1930. Haldane passed away on December 1, 1964.

R. I. P., J. B. S.

Agrawal, A., & Whitlock, M. (2010). Inferences About the Distribution of Dominance Drawn from Yeast Gene Knockout Data Genetics DOI: 10.1534/genetics.110.124560