Category Archives: Hemiscience

The Baseball Playoffs are a Crapshoot, but Having 100 Wins Doesn’t Hurt

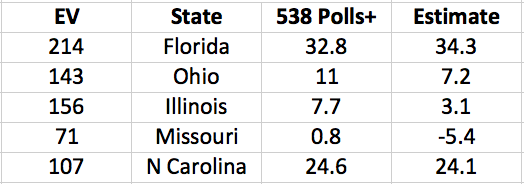
The Cubs wound up the regular season with the best record in baseball: 103 wins (out of only 161 games, due to a rain-out that went down as a tie). Does this guarantee that the Cubs will win it all this year? No. In fact, if you read Slate, “having such a record is nearly a kiss of death.”

Hmm

The premise of the piece seems that winning 100 games actually hurts you in the playoffs, as does having the best regular season record. What follows from that assertion would be an exercise in p-hacking, if any of the supporting evidence were statistically significant. Instead, it is exactly the sort of exercise in anecdotal misinterpretation that statistics were invented to avoid.

It is certainly true that having the best record in the regular season does not guarantee postseason success. Baseball is a game where any team can beat any other on a given day. Typically, only one or two teams win more than 60% of their games over the course of the regular season, and winning 55% will usually get you into the playoffs. When these teams play each other in a best-of-five or best-of-seven series, the odds of the “better” team coming out on top are not much different from a coin toss.

But does it hurt you? Let’s see what stats Slate musters to support the argument. They restrict their analysis to the 21 years from 1995 through 2015, when the playoffs have had the current wildcard structure. During that time:

• No National League team has won 100 regular-season games and won the World Series. The only team in baseball to achieve the feat is the New York Yankees, in 1998 and 2009. Only two 100-win National League teams have even reached the Series.

Okay, during that time period six National League teams and eight American League teams have won at least 100 regular season games. If each playoff was a 50/50 coin toss, each of those teams would have a one in eight chance of winning the world series. So, the expected number of NL wins would be 0.75, and the expected number of AL wins would be 1.0. The NL falls slightly below expectation (0/6), but not significantly so. The AL exceeds expectation (2/8), as does the combined NL-AL record (2/14).

No team other than the aforementioned 1998 and 2009 Yankees has posted the outright best record in baseball and won the World Series. Boston won the Series in 2007 and 2013 after tying for baseball’s best record.

In five of the 21 years, there was a tie for the best record in baseball. So, in the 16 years with a single best record, that team won the world series twice. Again, coin toss would give you a one in eight chance, so 2/16 is right in line with expectations. In the five years with a tie, there’s a one in four chance that one of those two teams will win, so the expected number of wins would be 1.25, less than the 2/5 Red Sox wins.

Last year, Kansas City became the seventh team of the wild-card era to post the best record in its league (excluding Boston’s tie in 2007) and win the World Series. In that same span, six wild-card teams have won the Series.

Well, if it’s a coin toss, the team with the best record would have the same odds of winning as the wildcard (or the two wildcards combined, in the extra-expanded playoff structure in place since 2012). So, pretty much what you would expect.

• The top National League team in the regular season hasn’t won the World Series since the Atlanta Braves did it in 1995.

This is the first statistic that seems to deviate at all from expectation. In 21 years, if the top NL team had a one in eight chance of winning the World Series each year, you would expect 21/8 World Series wins. That is, more than two, but fewer than three. And one is less than two, right? Well, the probability that you would have zero wins in 21 years is about 6%. The probability that you would have one win is about 18%.

The standard way to ask this question is to say, “What is the probability that the observed value would deviate by this much or more from expectation”.  That probability, in this case, is about 24%. So, not really all that unlikely at all.

Or, in sciencey terms, p=0.24, and we fail to reject the null hypothesis that having the best record in the National League gives you less than a one in eight chance of winning the World Series.

Plus, it’s a bit weird to cherry-pick the top NL team. After all, we were just told that Kansas City was the seventh team to win the World Series after posting the best record in its league. The six cases besides 1995 Atlanta are all from the AL (and exclude the 2007 Red Sox, who tied with Cleveland for the best record).

So what would happen if we asked the analogous AL question. Well, of the 19 years when there was a single top record in the AL, six of those teams went on to win the World Series. The chances of at least six teams doing that, given 1/8 odds, is about 2.5%.

Now, we can’t really read anything into that result, since it is one of a number of statistical tests we did here, so any multiple-tests correction would eliminate the significance of the results. But if we had asked the question about top AL records in isolation, notice that it would have supported the conclusion that having a good regular-season record helps, rather than hurts, your playoff chances.

I wonder why they didn’t include that analysis . . .


Proportional Delegate Allocation Could Have Stopped Trump

After yesterday’s primary in Indiana, both Ted Cruz and John Kasich have dropped out of the race, leaving Donald Trump as the presumptive nominee for the Republican party. This was disappointing to those of us who were hoping for some contested-convention drama, but sensible, since Trump is now virtually certain to go into the convention with the 1237 pledged delegates required to secure the nomination on the first ballot.

At various points during this primary season, I’ve calculated what the delegate counts would have been under alternative allocation schemes. The Republican party uses a process that varies from state to state. In general, the early states tend to allocate delegates more proportionally among candidates, while later states tend to be more winner-take-all. By contrast, the Democratic party uses a uniform method: proportional allocation among the candidates receiving more than 15% of the vote (applied both at the state and congressional-district levels).

Under the actual scheme, Trump currently has about 1013 pledged delegates (plus, possibly, some supporters among the formally unpledged delegates from Pennsylvania). He only needs to win about half of the remaining 445 delegates to reach the threshold, and he would be almost certain to do so, even if Cruz and Kasich stayed in the race.

Screen Shot 2016-05-04 at 3.20.37 PM

However, if the Republicans used the Democratic scheme (applied only at the state level, for simplicity), Trump would have 912 pledged delegates, and would need 73% of the remaining delegates to prevent a contested convention. Under proportional allocation with no threshold, he would have 799 delegates, and would need to win over 98% of the remaining delegates.

One consequence of (and perhaps rationale for) using winner-take-all allocation in a drawn-out primary season is that it drives out challengers, forcing consensus around the leading candidate and allowing them to begin their general-election pivot earlier.

Another consequence is that a pesky plurality of “voters” can drive the nomination of an openly bigoted narcissist, subverting the ability of the party elite to install one of the usual cryptically bigoted narcissists. That’s a consequence that will either be hilarious to Democrats in November or hilarious to extraterrestrial archaeologists who visit the smoldering remains of our planet thousands of years in the future.

Methodological notes:

  1. For these projections, I used some made-up numbers for the Virgin Islands, Colorado, and Wyoming, which have 75 delegates among them, but did not hold popular votes. For the proportional allocation numbers (with and without thresholding), I gave Trump 36 of those, Cruz 25, and Kasich 14. You could argue for different made-up numbers, but it would not alter the basic story.
  2. I quit assigning delegates to candidates after they suspended their campaigns. In certain states, due to early voting, under a strictly proportional allocation scheme, some candidates would have earned a few delegates after quitting the race. More significantly — but even harder to control for — under a different allocation scheme, candidates would have made different decisions about whether/when to drop out, how/where to spend their time and money, and so on.

Predictor and Explainer for the New York Republican Primary

Today, both the Republican and Democratic parties will be holding their primaries in New York. What should we expect from the Republican primary?  Briefly, the most likely outcome is that Donald Trump will walk away with more than 80 of New York’s 95 delegates. The exact number will depend on the share of the vote that Trump gets, both statewide and in the various congressional districts. However, there are 27 congressional districts, which is a large enough number that we can predict the distribution of results, without worrying about the details of individual districts. That, along with New York’s delegate allocation rules, gives us the following curve:

tny

538’s final polling average has Trump at 52.1%. We can adjust this based on the relationship between Trump’s polling numbers and his final performance, but the adjustment turns out to be pretty small. Best guess is for Trump to get 51.9% of the vote, which would give him about 84 delegates.

That’s the headline. If you’re interested in the details, keep reading.

The red line is the predicted relationship and the black dot is the specific prediction. The blue line is an alternative predicted relationship based on a lower variance among congressional districts (details below).

Delegate Allocation

New York has a total of 95 delegates for the Republican primary. Fourteen of those are allocated based on the statewide results. The other 81 are allocated based on the results in the various congressional districts.

Statewide Delegates

If one candidate gets more than 50% of the statewide vote, they get all 14 of the statewide delegates. If not, delegates are allocated proportionally among the candidates receiving at least 20% of the vote. That’s what creates the discontinuity in the graph above. If Trump gets over 50%, he’ll get all 14. If he gets just under 50% (and Cruz and Kasich both get over 20%), he’ll probably get seven of them.

That graph assumes that both Cruz and Kasich get at least 20%. In the unlikely and very specific scenario where, say, Cruz gets 19.9% and Trump gets 49.9%, Trump would get about 5/8, or about 9 of the statewide delegates. That’s not a big difference, but it is sort of interesting that, in New York, it might be that a strategic anti-Trump movement would want to split their votes between Cruz and Kasich to ensure that both get over the threshold. That runs counter to the conventional wisdom in most states, which says that anti-Trump voters should rally behind whichever non-Trump candidate is more viable.

Congressional-District Delegates

Three delegates are allocated on the basis of the results in each of New York’s 27 congressional districts. Here are the rules that are relevant to the current election:

If one candidate receives more than 50% of the vote, they get all three delegates.

If not, the leading candidate gets two delegates, and the second-place candidate gets one.

Given Trump’s commanding lead in the polls, it seems likely that he will win most or all of the congressional districts. His delegate haul will depend primarily on the number of districts in which he gets over the 50% mark.

We can guess at this if we assume that the individual congressional districts are Normally distributed around a mean given by the statewide result. What we need, then, is a standard deviation for that distribution.

If we look at earlier Republican primary results, we find that the standard deviation among congressional districts clusters around two values. Most of the states for which results by congressional district are available have standard deviations of around 4, including Missouri, Mississippi, Texas, Tennessee, Oklahoma, Arkansas, and Alabama. But Wisconsin and Georgia both had standard deviations of around 7. My instinct is that New York is more like Wisconsin and Georgia, and the curve shown above uses a standard deviation of 7.

If we use a lower standard deviation, like 4, we get the blue curve in the figure above. The upper part of the curve gets a bit steeper. If Trump gets over 50% statewide, reduced variance among congressional districts means that he falls below 50% in fewer of those districts.

The lower part of the curve is fairly insensitive to the standard deviation. If Trump is below 50% on average, higher variance means that he gets over 50% in more congressional districts. However, it also means that he is more likely to come in second in other congressional districts. On the whole, it’s a wash. The curves above assumes that Trump comes in second in any CD where he receives less than 37% of the vote.

Prediction for Wisconsin Dem Primary: Sanders by 8%

Going into today’s Democratic primary in Wisconsin, the polls have Sanders with an edge of 2-3 percentage points over Clinton. The obvious expectation would thus be that Sanders will win by about two or three points. Except that the polls have been wrong this primary season. I’m not talking about Michigan, where polling missed the election outcome by 20 points — or not just about Michigan anyway.

Previously, I did a simple linear regression on the primary results to date, comparing the final polling averages and projections to the actual outcome. I’ve updated that analysis with the more recent results, although the result is more or less the same:

Dem Primary Regression 4-4-16
Regression of final projections from 538’s Polls Plus model versus election outcomes in the Democratic primaries. The red square is the prediction for today’s Wisconsin primary, where the final polling numbers have him up by about three points.

When we compare the final polling averages to election outcomes, we find two things. First, the regression line has a slope greater than one: in the states where Clinton was expected to win big, she mostly outperformed expectations; in states where Sanders was favored, he tended to overperform. This sort of effect might come from a variety of places. For example, it could be that late-deciding voters tend to go with the candidate they think will win, or it could be that voters supporting a candidate very likely to lose become demoralized and stay home. Or, probably, lots of other things.

Second, there is an offset of about 5 points. That is, in close races, Sanders does about five points better on average than the final polling numbers would predict. I am fairly certain that this offset is due to a mismatch between the voter turnout models used by pollsters and the reality this election. Specifically, this election seems to have significantly higher turnout among younger voters compared with previous years. And those younger voters heavily favor Sanders. So, when a pollster constructs their final numbers using a model based on 2012 turnout, they underestimate the number of young Sanders supporters.

The final projection from 538’s Polling Plus model has Sanders winning 50.2% of the vote in Wisconsin to Clinton’s 47.2%. Plugging that into the regression formula gives a Sanders margin of victory of 8.3%.

In the Democratic primaries, delegate apportionment tends to track pretty close to the raw vote totals. So this would project Sanders to win about 46 of the state’s 86 pledged delegates.

In order to go into the national convention with half of the pledged delegates, Sanders needs to win a little over 56% of the remaining delegates. An eight-point win today would give him about 54% of today’s delegates, which would leave the race in pretty much the same state it has been in for a while: Sanders has a shot at overtaking Clinton, but you would not get anything close to even odds on it.

One methodological note: the regression presented here does not include any of the results from the last two rounds of primaries and caucuses — most of which Sanders won by large margins — because there was little to no polling data for those states in the run-up to their elections.

One final note: the conventional what-passes-in-political-punditry-as-wisdom is that Sanders does best in caucus states, while Clinton does better in primaries. That may be true, but all of the points included here are from primary states, with the exception of Nevada. (If we exclude Nevada, the projection changes only slightly: to Sanders by 8.8%.) So, even if there is a primary versus caucus effect, the fact that caucus states received so little polling means that is does not have much effect on this analysis.

Polling Projections for Today’s Democratic Primary

Today, March 15, the Democratic primary will be allocating 691 delegates based on voting in Florida, Ohio, Illinois, Missouri, and North Carolina. Yesterday, I posted a rough calculation suggesting that Sanders would need to win about 351 of those delegates in order to be on track to win half of the pledged delegates before the convention.

[NB: If he wins more than that, it by no means guarantees that he will win the nomination. Similarly, if he wins fewer, it does not guarantee that Clinton will win. Which is to say, whomever you support, go vote! Also — maybe even more importantly — figure out who sucks the least in your local down-ballot races, and vote for them!]

So what is actually going to happen today? Well, if we look at the polling averages at aggregators like Real Clear Politics or 538, they suggest that Clinton will carry all five states, with big wins in Florida and North Carolina, and narrower margins in Ohio, Illinois, and Missouri. But is taking the polls at face value the best approach? (Spoiler: No)

We’ve now had enough primaries that we can reasonably compare polling averages and actual outcomes. The following three graphs plot the advantage held by Clinton in the final polling averages or projections before each primary versus Clinton’s actual margin of victory. So, Sanders victories show up as negative numbers. These plots do not include states like Colorado and Minnesota, where there was very little polling before the primaries, and also leaves out Vermont and Mississippi — because you start to get non-linear behavior in landslides.

First, for Real Clear Politics’s polling averages:

rcp315

The red line is a linear regression, and the blue line is what you would expect if polling were accurate. Michigan is a big outlier, but the rest of the results lie reasonably close to the line (overall R2 = 0.84).

Looking at the blue curve, it seems clear that the polls systematically underestimate the margins of Clinton’s victories in the states where she wins big, and they underestimate Sanders’s performance in states where the competition is close.

The slope of the red line is 1.46, and the intercept is –6.58. One interpretation of the >1 slope would be that undecideds tend to go with the winner, because they shake out proportional to the rest of the voters and/or due to a bandwagon effect. The negative intercept, on the other hand, suggests a systematic underestimation of Sanders’s support. Given the very pronounced difference in the typical ages of Sanders and Clinton supporters, and the high turnout of young voters in this primary, I’m inclined to think that this reflects a mismatch between polling firms’ likely voter models and reality.

Whatever the reasons, the red line does give us a way to estimate likely outcomes based on the polling data. Here’s what that looks like:

Screen Shot 2016-03-15 at 1.46.50 PM

Here, again, the values indicate Clinton’s expected margin of victory. This regression would predict narrow wins for Sanders in Missouri and Illinois, a narrow win for Clinton in Ohio, and huge wins for Clinton in Florida and North Carolina. This outcome would give Clinton about 399 delegates and Sanders 292.

We can do the same thing for 538’s polling averages. The difference is that RCP uses a simple average of some number of the most recent polls, while 538 uses a continuous weighting scheme to account for poll recency as well as weights reflecting sample size and performance history of individual polling firms. The result is qualitatively similar, however:

po538315

Here the slope is 1.4, offset –6.33, and R2 = 0.89. This predicts results of

Screen Shot 2016-03-15 at 2.09.38 PM

Compared with the RCP analysis, this predicts a smaller margin for Clinton in North Carolina, but predicts that she will win Illinois. The predicted overall delegate haul is nearly identical, though: Clinton 403, Sanders 288.

Finally, we can look at 538’s “Polls Plus” estimator, which includes information about things like endorsements:

pp538315

Here, the slope is much lower, 1.24, indicating that this method has done a better job of predicting the magnitude of Clinton’s previous wins. The offset is similar, at –6.44, and the fit is the best of the three, with R2 = 0.91. Predicted results:

Screen Shot 2016-03-15 at 2.10.20 PM

Projected delegate count: Clinton 401, Sanders 290.

This would, of course, fall quite short of Sanders’s target of 351.

So, in order not to lose even more ground to Clinton, Sanders would need to a substantial swing. Is that possible? The results in Michigan clearly indicate that it’s possible, although the results from all of the other states suggest that it’s not very likely.

There are a couple of places a substantial deviation could come from. First, if actual voter prefernce has been changing rapidly over the past week, the polling averages will naturally lag behind that change. Even individual polls are typically conducted over the course of a few days. So, if Clinton’s recent statements about Nancy Reagan, or the Chicago protests, or the Death Penalty, or Libya have alienated any Democrats, that may not be fully reflected in the polls.

Second, in states with open primaries, Democratic voters may cross over, particularly in light of the increasingly urgent anti-Trump movement. If those crossover voters are substantially more likely to be Clinton supporters than Sanders supporters, that would create a shift. A friend in Michigan told me, anecdotally, that she knows a number of Clinton supporters who did just this, partially due to the polls, which indicated that Clinton would win the state easily.

Adding a ten-point swing (e.g., due to 5% of voters switching from Clinton to Sanders) to the 538 Polling-Plus projections would give Sanders victories in Ohio, Illinois, and Missouri, and would produce a delegate count of Clinton 366, Sanders 325. This, incidentally, would be very close to 538’s uncorrected delegate targets.

Sanders would need a swing of about 17.5 points in order to reach the delegate target of 351, which accounts for Clinton’s current lead.

Of course, even if there is a swing, it is unlikely to be uniform across the states. Which means that it is finally time for tea-leaf reading!

I wanted to get down my own predictions, which are going to start from the 538 Polling Plus correction described above, but then use some intuition based on eyeballing the polls for trends and outliers. Here goes:

Florida: Clinton +30, Delegates: Clinton 139, Sanders 75
There’s a modest trend in the past few days that is not captured in 538’s average, but it may not have much effect, due to high rates of early voting in Florida.

Ohio: Sanders +1, Delegates: Sanders 72, Clinton 71
There’s again a sharp recent movement toward Sanders, and, if crossover votes do take away preferentially from Clinton, this is the state where we should see the biggest effect.

Illinois: Sanders +5, Delegates: Sanders 82, Clinton 74
Here, there are polls from March 7 and earlier, which all have Clinton leading by 20 to 40 points. Four polls with more recent data give Clinton an average lead of +2, and the three that are entirely from the last week give Clinton an average lead of less than 1 point.

Missouri: Sanders +8, Delegates: Sanders 38, Clinton 33
Very little polling data here, but, again, evidence of a recent shift towards Sanders.

North Carolina: Clinton +22, Delegates: Clinton 65, Sanders 42
Maybe a recent shift, but probably not more than a point or two.

Total: Clinton 382, Sanders 309

This would put Sanders still short of his targets, but, if he can actually claim victory in Ohio, Illinois, and Missouri, that will probably be enough to maintain his plausibility as a candidate. And so we will reconvene for the next round of primaries!

What if the GOP Allocated Used Proportional Allocation of Delegates?

In the Republican presidential primary system, different states apportion their delegates among the candidates in a variety of ways. In the upcoming contests in Florida and Ohio, all of the state’s delegates are pledged to the candidate who receives the most votes state-wide. In Nevada, delegates are allocated proportional to the vote total (you get one of the 30 delegates for each 3.33% of the vote you get).

But a lot of the states are much more complicated. In South Carolina, three delegates are assigned to the leading vote-getter in each of the seven congressional districts, and the remaining 29 go to the winner statewide. Trump won all 50 this year by leading the pack in each congressional district.

A number of the states impose a minimum threshold. For example, Massachusetts and Kentucky do proportional allocation of their 42 and 46 delegates, respectively, among all candidates receiving at least 5% of the state-wide vote.

Several states add a winner-take-all threshold. Vermont does proportional allocation of its delegates among candidates who receive at least 20% of the state-wide vote. But if any candidate gets more than 50%, they receive all 16.

In general, the effect of these rules is to push delegates towards the winning candidates — and drive inviable candidates out of the race. This happens gently at first, as many of the early contests are more proportional. Then, as the season progresses, things take on more of a winner-take-all flavor.

Here’s what the allocation bias looks like in the Republican primaries and caucuses that have taken place through March 8 (data from The Green Papers):

rvd

The brownish-orangish line is what you expect from strictly proportional allocation of delegates, and the points plotted indicate allocations from individual state-wide (and Puerto Rico-wide) contests. Red is Trump, Blue is Cruz, Purple is Rubio, and Black is Kasich.

One thing you can see from the plot is that Trump seems to be the greatest beneficiary of the current allocation system. This makes sense, of course, since he’s the frontrunner, and the system is basically designed to drive a consensus around the frontrunner. And, if the frontrunner were anyone other than Donald Trump, the Republican leadership would probably be very pleased with how it was working.

As a little thought experiment, here’s what the current delegate score would look like if all of the Republican primaries and caucuses used proportional allocation without a viability threshold (besides whatever minimum percentage is required to get one delegate):

Screen Shot 2016-03-09 at 6.02.42 PM

That’s not to say that things would have worked out this way under that allocation scheme, since a different scheme would have led to different reporting, different campaign strategies, and so on. But, it’s a nice simple way to quantify the effect of structural properties of the primary system on the outcome.

In that spirit, what this tells us is that about a fifth of Trump’s delegate total — and about half his lead over Cruz — can be chalked up to Republican delegate allocation math.

We could ask the same question for the Democrats, but it is not nearly as interesting. All of the Democratic contests follow the same formula: proportional allocation of delegates among candidates exceeding 15% of the vote. About a third of the delegates come from applying this formula to the state-wide vote, and about two thirds from applying it individually to each congressional district.

That system also punishes low-performing candidates, but it does not reward high-performing ones in the same way. There are no winner-take-all states or triggers (unless you win more than 85% of the vote, guaranteeing that no one else reaches 15%).

So, the Democratic system leans a bit more towards proportional overall. But much more important is the fact that there are only two competitive candidates, both of whom are rarely in danger of failing to meet that 15% threshold.

dvd

Red points represent Clinton, and Blue represent Sanders. The only real outliers are Vermont, where Sanders got 86% of the vote, and Mississippi, where Clinton topped 85% in two of the state’s four congressional districts.

I’m not advocating for any particular delegate allocation scheme here. We know there’s no perfect voting system. I just hope to contribute in my own small way to the enormous pile of regrets plaguing Republican party leaders as Trump sits atop his throne of skulls forcing them to fight to the death.

Don’t Forget Ben Carson, Who is Also Wrong About the Supreme Court

In the wake of Supreme Court Justice Antonin Scalia’s death, Republicans have been climbing all over each other like a less well intentioned pile of zombies in an effort to most loudly claim that President Obama has no right to appoint his successor. Most of the arguments have focused on the fact that we have now entered the final year of Obama’s presidency. As you will recall, back in 2012, the ballots for president clearly stated that the results would only be construed as representing the will of the people for the next three years.

Obviously, these arguments fail any non-disingenuous reading of the constitutional and historical evidence (and contradict arguments previously made by many of those same Republicans), but, you know, the constitution, like the bible, is sacred, infallible, and beyond scrutiny — except when it turns out to be politically inconvenient.

But at the most recent Republican debate, everyone’s favorite cingulocidal maniac Ben Carson offered a different argument:

Well, the current constitution actually doesn’t address that particular situation, but the fact of the matter is the Supreme Court, obviously, is a very important part of our governmental system. And, when our constitution was put in place, the average age of death was under 50, and therefore the whole concept of lifetime appointments for Supreme Court judges, and federal judges was not considered to be a big deal.

Carson is correct that the “average age of death” used to be under 50. In fact, it did not exceed 50 until sometime in the early 20th century. However, as anyone with any educational background in public health or medicine might be expected to know, the dramatic gains in life expectancy have come mostly from reductions in early-life mortality, due to things like sewers, vaccines, and antibiotics. So, unless the Founding Fathers were appointing toddlers to the Supreme Court (spoiler: they weren’t), life expectancy at birth is pretty irrelevant. Here are a couple of graphs (generated here):

Screen Shot 2016-02-17 at 1.46.20 PMScreen Shot 2016-02-17 at 1.47.13 PM

The gray line is life expectancy at birth from 1850 to 2000. The orange and red lines are life expectancy from age 60 for women and men, respectively. Since people are not typically appointed to the supreme court until they are in their 50s, this is actually the relevant data.

So, it is true that someone appointed to the supreme court today might be expected to live longer on average than someone appointed in the 19th century, but only by about ten years. But does that mean that justices given lifetime appointments to the supreme court serve longer than they used to? Not so much. Here are a couple more graphs, constructed from this data:

scp

In the top panel, each diagonal line indicates the term of a single Supreme Court Justice, running from the date and age of appointment to age date and age of death or retirement. The black lines are justices who died in office, red lines are justices who resigned or retired, and blue lines are the eight justices currently serving.

In the bottom panel, each dot represents a single justice. “Mid-Term Year” is the halfway point of their tenure (middle of the line in the top graph), and duration is how long they served (length of the line in the top graph. The line is a ten-point moving average. Current justices are not included.

Notice that justices were not often dying by age 50, even in the early days. There are a couple of interesting trends, though.

First, there’s a transition as we get into the 20th century, when it becomes much more common for justices to retire, rather than die in office. So, while the upper limit on the age we might expect a justice to live to might have increased by about ten years, the upper limit on the age at which they leave the court has not changed substantially in 200 years.

Second, after an initial shake-out (during which many of the justices did not have any sort of legal credentials), the long-term trend from 1820 to 1950 is towards shorter average term lengths (declining from around 20 to around 15 years). Starting with the second half of the 20th century, the trend has been towards longer tenures, with a recent average closer to 25 years. However, if you look at the scatter plot, you can see that this increase is mostly due to the absence of any short-term justices since 1970.

So, it is true that we should probably expect that the next person appointed to the Supreme Court will be there for the next twenty to thirty years, but terms of that length have been around since the beginning.

Actually, Iowa is not quite that smart

Last Thursday, Donald Trump gave a 95-minute speech in Iowa that was variously characterized as “unhinged” (by most people) or “a liberal conspiracy” (by Trump supporters). A significant portion of the speech was devoted to Ben Carson, who had recently overtaken Trump in Iowa polling. As part of his rant, Trump asked, “How stupid are the people of Iowa?”

On Friday, the Washington Post published an informal analysis of the relative intelligence of different states. In answer to Trump’s question:

Well, we can answer that. Not stupid at all. In fact, Iowa is one of the smartest states in America.

This is necessarily hard to figure out, of course, given that “stupid” is inherently contextual and subjective. In order to figure out how smart each state was, we looked at objective measures we had at our disposal.

. . .

The results? Iowa is the eighth-smartest state, behind, in order: Massachusetts, Minnesota, New Hampshire, Connecticut, Wisconsin, Kansas and Vermont. Donald Trump’s home state of New York came in 17th. The bottom five states were Florida, Alabama, Mississippi, Nevada and, in the 50th spot, Hawaii.

The Washington Post analysis combines four metrics: mean IQ score, mean SAT score, mean ACT score, and percentage of college grads. Each of these was converted to a percentage difference from the national median. They were then combined, with IQ being given twice the weight of the other three metrics.

Now, there are a lot of caveats here, which the Post is aware of, and there are certain tweaks one might make. (For example, I might favor Z-scores over percentage difference from the median. Plus, there’s the conflation of intelligence and education, the confounding of those concepts with social and economic opportunity, etc., etc.) But, most of those probably don’t qualitatively change the conclusions of the analysis, and I’m not going to worry about them here.

However, there is something striking when you look at the metrics themselves. There seems to be a trend where states with positive SAT deviations (average SAT scores above the national median) have negative ACT deviations. For example, Alabama has an ACT deviation of -10.3, but an SAT deviation of +4.3. Maine’s deviations are +13.6 on the ACT and -10.4 on the SAT. Massachusetts has a +14.6 on the ACT, but a -0.1 on the SAT. In fact, the correlation between ACT deviations and SAT deviations across all 50 states is r=-0.31. So what the heck is going on?

Screen Shot 2015-11-16 at 2.13.11 PM

Well, as it turns out, the variation in mean test score from state to state is determined almost entirely by test participation. The larger the percentage of kids who take a test, the lower the average test score. That’s presumably because, if 10% of the students in your state take the SAT, it’s not a random 10%. It is the most highly motivated students who are trying to beef up their college applications.

Here are the relationships between participation rate and test score in the data used by the Washington Post (found here and here):Screen Shot 2015-11-16 at 3.01.13 PM Screen Shot 2015-11-16 at 3.01.06 PM

The correlations are r = –0.90 for the SAT and r = –0.81 for the ACT. That means that the vast majority of the variation in test scores from state to state is accounted for by differences in participation.

So, one simple thing to do is to fit a line through each of these distributions. Then, we can use that line to estimate what the mean test score would have been for each state if 100% of the students had taken the test.

First off, after we make this correction, it turns out that the mean ACT and SAT scores in a state are positively correlated (r=0.73). So that makes it seem more plausible that we are looking at two different measures of the same underlying trait (“intelligence” combined with various cultural and economic factors).

Then, using the same formulation as the Post’s original ranking, we get this:

Screen Shot 2015-11-16 at 3.22.39 PM

The “Change” column indicates how many positions up or down a state moves in the rankings after making this adjustment for test participation.

Iowa moves down six spots from #8 to #14, but is still above the average, and still above New York. Other big losers are Oklahoma and New Mexico, both of which also move down six spots.

The biggest winners are North Carolina (+9), Florida (+8), and Hawaii (+7).

So why the shifts? In general, there are SAT states and ACT states. That is, in most states have very high participation in one of the tests and very low participation in the other. North Dakota is an ACT state, with 100% participation in the ACT, but less than 10% in the SAT. Maine is an SAT state, with >90% SAT participation, but only 10% ACT participation. In states like these, the two corrections tend to balance each other out.

The states that move down most dramatically when we make the correction are those that have low participation in one test, but only modest participation in the other. For example, Iowa has <10% SAT participation, but only 67% ACT participation. So, 25-35% of the students in Iowa took neither test. What this analysis suggests is that if they had taken one of the tests, they probably would have brought Iowa’s average scores down.

Conversely, the states that move up are those where a significant fraction of students take both tests. In North Carolina, which jumped from 42nd to 33rd, 100% of students took the ACT, and 60-70% of them also took the SAT.

But note that none of this undermines the central take-home message of the Post’s analysis: Donald Trump is a goddamn moron.

The Weird Racism of Doctor Who

Is Doctor Who a racist show? On the surface, it seems like a silly question. After all, there have been a number of prominent non-white characters. Moreover, the interracial and same-sex relationships in the show are presented as run-of-the-mill, everyday occurrences. Perhaps relatedly, the franchise has a strong reputation for its diverse and well-rounded portrayals of lesbian, gay, and bisexual characters.

This is one of the great affordances of science fiction. Particularly in a show set in the future (or at least set intermittently in the future, or in an alternate reality), you can take a strong prescriptive position, where the race, sex, or gender of someone’s romantic partner is unimportant or even uninteresting. Whether or not this would be a realistic expectation of how people would act in the real world, you can assert that obviously no one will care in the future. Or you can construct a plausible alternate universe where no one cares.

Basically, in science fiction, you can choose to portray certain aspects of your world not as they are, but as you believe they should be.

So the treatment of race and sexual orientation strikes me as the product of a conscious decision by a show with a progressive agenda. But that just makes the places where the show falls short all the more puzzling.

What do I mean? Well, there are two things, and I’ll go through each one separately. First, while there is a reasonable representation of non-white characters, they are almost entirely of African ancestry. People of South Asian descent (including Pakistan, India, and Bangladesh) appear infrequently and only in minor roles. This despite the fact that South Asians constitute by far the largest minority in England. Second is that the mixed-race romantic relationships between major characters don’t seem to work out.

First, let’s look at the racial diversity in the show. There are different ways to do this, and I’ve examined four possible approaches. All four give the same qualitative answer: the cast is about 85% white, and among the non-white characters, people of African ancestry outnumber people of South Asian ancestry by a ratio of somewhere between 4:1 and 8:1.

More specifically, a few weeks ago I went through IMDB for the new Doctor Who series (post 2005), and collected all of the (222) characters who appeared in at least two episodes. So, this data is current up to about 2/3 of the way through the new season, but the numbers are large enough that the past few episodes won’t change the results. For the vast majority of characters, it was straightforward to identify them as European, African, or South Asian. Only one actor, Chipo Chung, did not fit this categorization, being half Zimbabwean and half Chinese. For purposes of this analysis, she was given her own category.

Using these categorizations, I calculated the number of characters/actors of each race (where David Tenant counts as 1 European and Matt Smith counts as 1 European) as well as the number of character appearances of each race (where David Tenant contributes 52 appearances by a European and Matt Smith contributes 48 appearances by a European). Each of these was calculated both including and excluding Aliens — characters whose race was not perceptible in the show (Dalek operators, Silurians, etc.). Here are the results for the four combinations: Character Demographics

The code here is blue for European, green for African, mustard for South Asian, and red for Chipo Chung. The outermost ring (appearances by actors of identifiable race) is the one that seems to me to be the best match for what we’re interested in.

Of course, the question is, compared to what? The natural comparison would seem to be the demographic composition of the UK, since it’s a British show, and most of the scenes set on Earth are set there. Here, using the same color scheme, is what that looks like:

England Demographics

The first thing to note is that diversity, overall, is pretty good. By the four different metrics, Doctor Who’s cast is somewhere between 81% and 87% white. The thing that is striking is the difference in the composition of the non-white portion. In England, South Asians outnumber Africans by more than 2 to 1. In Doctor Who, Africans outnumber South Asians by 4.7 to 1 (counting characters) or 8.4 to 1 (counting appearances). That’s a distortion of 10-fold or more.

What about the mixed-race romantic issues? There are three big ones: Rose and Mickey, Martha pining after the Doctor, and Clara and Danny in the season that just concluded. Let’s review.

When Rose first becomes a companion, she is dating Mickey. She sort of gradually breaks up with him and becomes attached to the Doctor. Mickey keeps after her for a while, but eventually gives up. After some regeneration shenanigans, the Doctor sends his doppelganger off to live happily ever after with Rose in another dimension.

Martha is the Doctor’s next companion, and although she has a romantic interest in the Doctor, it is completely unrequited from start to finish. Eventually, Mickey and Martha become a couple in a (different) alternate dimension where they fight Cybermen all the time. So, what we have is two black characters who are in love with white characters, but are rejected by them. The two white characters fall in love, and the two black characters become a couple in what seems to be both of them settling for their second choice (in a dystopian hell-scape no less).

Until the season finale aired, I was holding out hope that the mixed-race romance between Clara and Danny would reach a happy conclusion. Instead we got a pattern similar to the other two. Danny was devoted to Clara, but while she loved him, her primary commitment was to the Doctor. The fact that Danny was and would always be playing second fiddle was spelled out in pretty explicit (and heartbreaking) detail in the finale.

Now, three is a small number, and you can always argue that this is just coincidence, rather than some systematic racial thing. I’m sure a dedicated enough Doctor Who apologist could rationalize the racial composition of the show as something unintentional. Or that we should cut them some slack because of all of the things the show does right.

What bothers me most, though, is that these patterns exist in a show that seems to have made a real effort to be careful about race, making me think they point to something really taboo. That despite a progressive agenda and a conscious effort to portray racial diversity, there are a couple of places that the show is unwilling or unable to go.

On the absence of South Asians, here’s the most generous theory I’ve come up with. Globally, American media has enormous reach and influence. Traditionally, having a diverse cast in American TV was more or less synonymous with having some African American characters. Only quite recently have other ethnic minority groups started to show up on TV in large numbers. So, maybe there’s a naive but deeply rooted notion in the minds of British producers that “diversity = black”. Maybe they’re unconsciously basing their model not on British society, but on American TV and movies of twenty years ago.

A less generous (but more plausible, in my mind) theory is that the show is simply avoiding engagement with the strongest form of British racism. My own experience, anecdotal though it is, is that most white British folks don’t really harbor negative racial stereotypes about immigrants from Africa — or immigrants of African descent from the Caribbean. However, attitudes toward South Asians are a very different (and offensive) story.

I have had multiple interactions that went something like this. British person talks about how racist Americans are, citing the treatment of African Americans. British person takes up moral high ground, citing their own open views towards Africans. British person says some really awful racist crap about Pakistanis or Indians — the sort of thing you never heard in public in post-Archie-Bunker, pre-Twitter America. When hypocrisy is pointed out, British person defends stance, saying something like, “You don’t have them. You don’t understand what they’re like.”

So, theory B is that if Mickey and Martha and Danny had all been Pakistani, Doctor Who might have alienated much of its British audience, including some people who self-identify as liberal. Or at least the producers feared that would happen. So, they cast black people for diversity, but avoid the racial group that is the focus of the greatest antipathy in Britain.

Similarly for the romantic relationships. Maybe it’s just coincidence that a white couple, Amy and Rory, get a happy ending (even if they do have to endure an insufferable series of World Series wins by the Yankees), while the mixed-race relationships fail when the white person just doesn’t feel quite the same way.

Or maybe the producers (rightly or wrongly) worry that Britain is not quite ready for a successful, normalized mixed-race couple, at least not one involving one of the show’s stars.

Or maybe the producers would say that this was just who the characters are, that it just would not seem right for Clara to go all in on her relationship with Danny. That given everything we’ve seen Clara go through, she would not be able to separate herself from the Doctor in that way. Fine. Perfectly defensible. But maybe if they had made Danny white, it would not have felt out of character to them.

Anyway, if Russell T. Davies and/or Steven Moffat are regular readers of the blog, I would invite them to share their take(s) in the comments.

How Many English Tweets are Actually Possible?

So, recently (last week, maybe?), Randall Munroe, of xkcd fame, posted an answer to the question “How many unique English tweets are possible?” as part of his excellent “What If” series. He starts off by noting that there are 27 letters (including spaces), and a tweet length of 140 characters. This gives you 27140 — or about 10200 — possible strings.

Of course, most of these are not sensible English statements, and he goes on to estimate how many of these there are. This analysis is based on Shannon’s estimate of the entropy rate for English — about 1.1 bits per letter. This leads to a revised estimate of 2140 x 1.1 English tweets, or about 2 x 1046. The rest of the post explains just what a hugely big number that is — it’s a very, very big number.

The problem is that this number is also wrong.

It’s not that the calculations are wrong. It’s that the entropy rate is the wrong basis for the calculation.

Let’s start with what the entropy rate is. Basically, given a sequence of characters, how easy is it to predict what the next character will be. Or, how much information (in bits) is given by the next character above and beyond the information you already had.

If the probability of a character being the ith letter in the alphabet is pi, the entropy of the next character is given by

– Σ pi log2 pi

If all characters (26 letter plus space) were equally likely, the entropy of the character would be log227, or about 4.75 bits. If some letters are more likely than others (as they are), it will be less. According to Shannon’s original paper, the distribution of letter usage in English gives about 4.14 bits per character. (Note: Shannon’s analysis excluded spaces.)

But, if you condition the probabilities on the preceding character, the entropy goes down. For example, if we know that the preceding character is a b, there are many letters that might follow, but the probability that the next character is a c or a z is less than it otherwise might have been, and the probability that the next character is a vowel goes up. If the preceding letter is a q, it is almost certain that the next character will be a u, and the entropy of that character will be low, close to zero, in fact.

When we go to three characters, the marginal entropy of the third character will go down further still. For example, t can be followed by a lot of letters, including another t. But, once you have two ts in a row, the next letter almost certainly won’t be another t.

So, the more characters in the past you condition on, the more constrained the next character is. If I give you the sequence “The quick brown fox jumps over the lazy do_,” it is possible that what follows is “cent at the Natural History Museum,” but it is much more likely that the next letter is actually “g” (even without invoking the additional constraint that the phrase is a pangram). The idea is that, as you condition on longer and longer sequences, the marginal entropy of the next character asymptotically approaches some value, which has been estimated in various ways by various people at various times. Many of those estimates are in the ballpark of the 1.1 bits per character estimate that gives you 1046 tweets.

So what’s the problem?

The problem is that these entropy-rate measures are based on the relative frequencies of use and co-occurrence in some body of English-language text. The fact that some sequences of words occur more frequently than other, equally grammatical sequences of words, reduces the observed entropy rate. Thus, the entropy rate tells you something about the predictability of tweets drawn from natural English word sequences, but tells you less about the set of possible tweets.

That is, that 1046 number is actually better understood as an estimate of the likelihood that two random tweets are identical, when both are drawn at random from 140-character sequences of natural English language. This will be the same as number of possible tweets only if all possible tweets are equally likely.

Recall that the character following a q has very low entropy, since it is very likely to be a u. However, a quick check of Wikipedia’s “List of English words containing Q not followed by U” page reveals that the next character could also be space, a, d, e, f, h, i, r, s, or w. This gives you eleven different characters that could follow q. The entropy rate gives you something like the “effective number of characters that can follow q,” which is very close to one.

When we want to answer a question like “How many unique English tweets are possible?” we want to be thinking about the analog of the eleven number, not the analog of the very-close-to-one number.

So, what’s the answer then?

Well, one way to approach this would be to move up to the level of the word. The OED has something like 170,000 entries, not counting archaic forms. The average English word is 4.5 characters long (5.5 including the trailing space). Let’s be conservative, and say that a word takes up seven characters. This gives us up to twenty words to work with. If we assume that any sequence of English words works, we would have 4 x 10104 possible tweets.

The xkcd calculation, based on an English entropy rate of 1.1 bits per character predicts only 1046 distinct tweets. 1046 is a big number, but 10104 is a much, much bigger number, bigger than 1046 squared, in fact.

If we impose some sort of grammatical constraints, we might assume that not every word can follow every other word and still make sense. Now, one can argue that the constraint of “making sense” is a weak one in the specific context of Twitter (see, e.g., Horse ebooks), so this will be quite a conservative correction. Let’s say the first word can be any of the 170,000, and each of the following zero to nineteen words is constrained to 20% of the total (34,000). This gives us 2 x 1091 possible tweets.

That’s less than 1046 squared, but just barely.

1091 is 100 billion time the estimated number of atoms in the observable universe.

By comparison, 1046 is teeny tiny. 1046 is only one ten-thousandth of the number of atoms in the Earth.

In fact, for random sequences of six (seven including spaces) letter words to total only to 1046 tweets, we would have to restrict ourselves to a vocabulary of just 200 words.

So, while 1046 is a big number, large even in comparison to the expected waiting time for a Cubs World Series win, it actually pales in comparison to the combinatorial potential of Twitter.

One final example. Consider the opening of Endymion by John Keats: “A thing of beauty is a joy for ever: / Its loveliness increases; it will never / Pass into nothingness;” 18 words, 103 characters. Preserving this sentence structure, imagine swapping out various words, Mad-Libs style, introducing alternative nouns for thing, beauty, loveliness, nothingness, alternative verbs for is, increaseswill / pass prepositions for of, into, and alternative adverbs for for ever and never.

Given 10000 nouns, 100 prepositions, 10000 verbs, and 1000 adverbs, we can construct 1038 different tweets without even altering the grammatical structure. Tweets like “A jar of butter eats a button quickly: / Its perspicacity eludes; it can easily / swim through Babylon;”

That’s without using any adjectives. Add three adjective slots, with a panel of 1000 adjectives, and you get to 1047 — just riffing on Endymion.

So tweet on, my friends.

Tweet on.

C. E. Shannon (1951). Prediction and Entropy of Written English Bell System Technical Journal, 30, 50-64