Category Archives: Politics

How Should Democrats Allocate Primary Delegates Among States?

The US Presidential election system is weird, but the primary system is really weird. Contests are strung out over the course of five months, with the rules varying from state to state — from who can vote to how the voting happens to how the delegates are allocated among the candidates.

For the Democratic Party, there are 4051 “pledged” delegates, whose first-ballot votes at the convention are determined by the results of state-wide (or state-equivalent-wide) primaries, and 714 “superdelegates”, party leaders and insiders of various sorts who can vote for whomever they want.

Allocation of Delegates

The exact number of delegates assigned to a given jurisdiction is determined in a number of steps (details here). First, each jurisdiction is assigned a base number of delegate votes. For the 50 states and DC, this base is 3200 time an “allocation factor” that is the average of two quantities. Half of the allocation factor is set by the fraction of electoral college votes for the jurisdiction (e.g., 3/538 for DC and 29/538 for Florida). The other half is the fraction of the nationwide popular vote for the Democratic presidential candidate that came from that state over the previous three elections.

That second factor does two things. First, it makes the delegate allocation more proportional to population — reducing the advantage given by the electoral college system to smaller states. Second, it rewards states that tend to vote Democratic.

evup

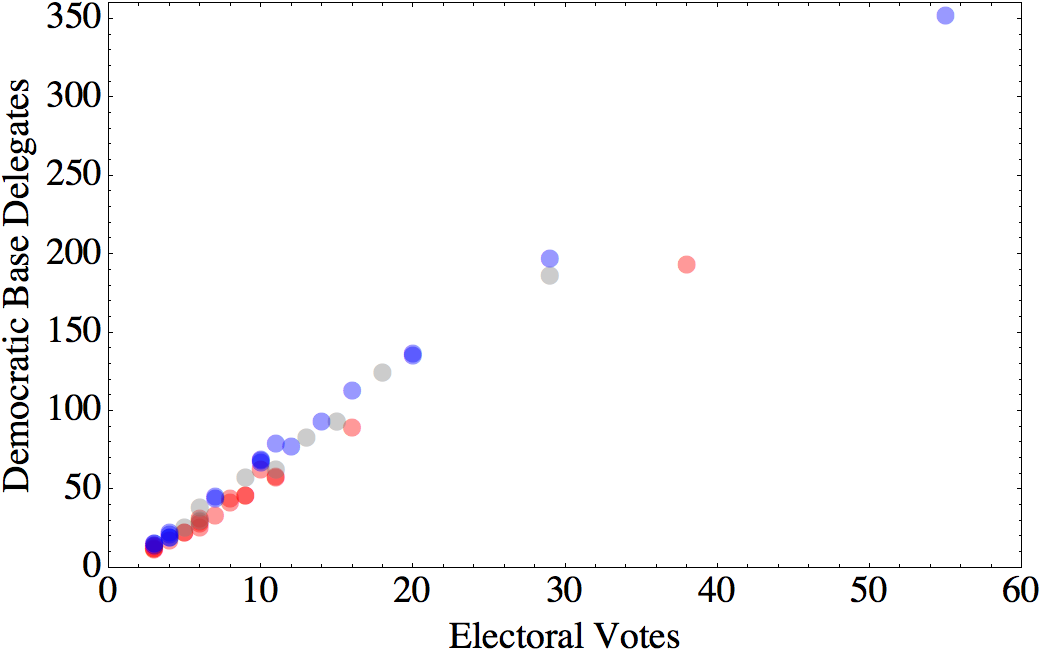
In this figure, blue dots indicate states that have gone for the Democratic candidate in each of the three previous elections, while red dots have gone for the Republican candidate in all three. Gray dots are states that have voted for the Democrat in either one or two of the three most recent elections. You can see that the slope of the red points is lower than that of the blue points.

You can also see how this scheme down-weights the electoral value of the small states, since the apparent y-intercept is below zero. We can see this shift more clearly if we replot this in terms of the number of delegates per electoral vote:

evbp

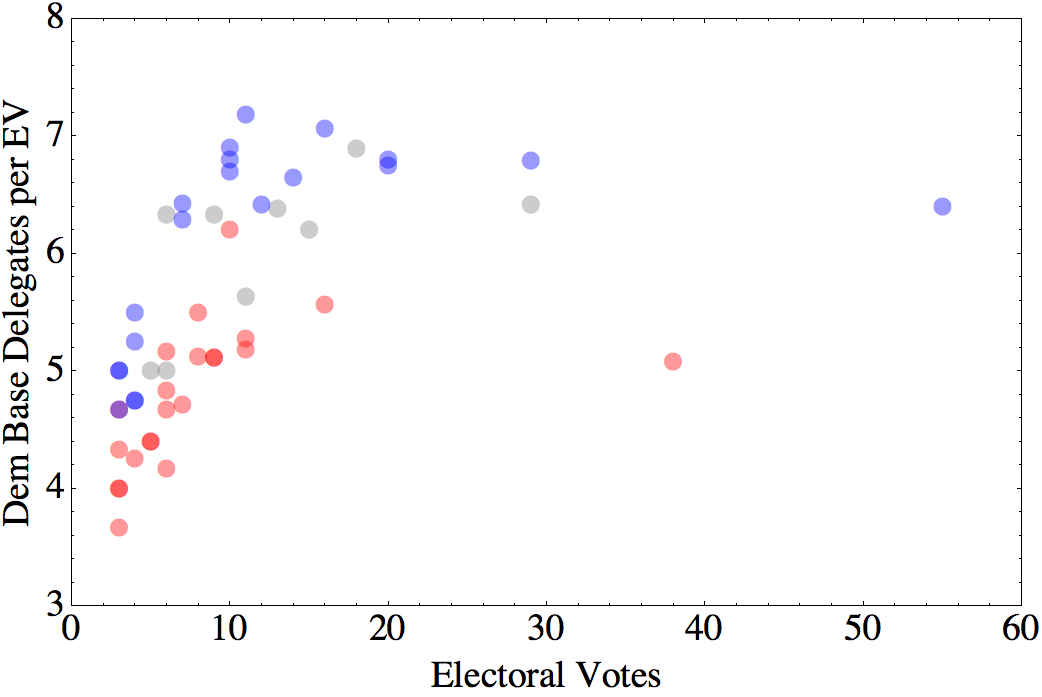
Note that the apparent purple point is actually an overlay of red and blue (Montana and Vermont).

Then, each state is given various bonuses based on when they hold their primary. For example, you get a larger bonus for holding your primary later in the season. And, for primaries held March 22 or later, you get a 15% bonus if you are part of a cluster of three or more neighboring states with primaries on the same day.

(Because in Democratic primaries, as in the Special Olympics, everyone is a winner, no state has an overall bonus of less than 15%.)

Delegates are also assigned to various jurisdictions that don’t actually get to vote in the presidential election, like Puerto Rico, and to “Democrats Abroad”, people living overseas, who would vote in the presidential election via absentee ballot in their home state.

How SHOULD delegates be allocated?

So, is this a sensible way to allocate delegates? It depends on the goal. The current system seems to be basically a hybrid of the electoral college system and a popular vote, with some additional features to reward party loyalty. It seems that the system aims to strike a balance among three competing goals:

  1. Pragmatic considerations of electoral math. Elections are determined by the electoral college, so a system that mirrors the electoral college seems more likely to produce a candidate who can win.
  2. A democratizing impulse. At the same time, there is a sense that the electoral college system is weird and not always fair. Skewing delegate weights towards population size, allowing proportional allocation of delegates within states, and allowing participation by groups that are normally excluded from the Presidential election all make the primary outcome a bit more like a nationwide popular vote.
  3. Community Building. If you reward states that produce Democrats and get them to vote, as well as states that get in line and follow the rules, you presumably hope that this will lead to more of both.

However, if we take the pragmatic angle seriously, there is something missing from this calculation. In the current political environment, the outcome of a Presidential election depends primarily on how candidates perform in the swing states.

Barring a landslide, come November, the Democrats are going to win Washington DC and Massachusetts, and the Republicans are going to win Wyoming and Mississippi. If the goal is to nominate a candidate who can prevent a dystopian Trump presidency, Clinton’s win in Alabama and Sanders’s win in Vermont are irrelevant. The primary results we should pay attention to are those from states that could determine the election outcome. Fare more important are the close results in Iowa and Nevada, Sanders’s victory in Colorado, and Clinton’s in Virginia.

So, the other thing you could include in your allocation factor is a measure of “swinginess”. There are a lot of ways you could do this, but here’s a simple one: calculate the mean and standard error of the difference between Republican and Democratic vote percentages in each state over the past three elections. Assuming those values are Normally distributed, calculate the probability that the winner is different from what we expect from the mean. So, if the mean difference is exactly 0%, the probability would be 0.5. If the mean difference is 5%, and the standard deviation is also 5%, the probability would be about 0.17. If the mean difference is 30%, and the standard deviation is 5%, the probability is effectively zero.

Take this probability and multiply it by the number of electoral votes. The result is something like the number of electoral votes you can expect to get by doing well in that state.

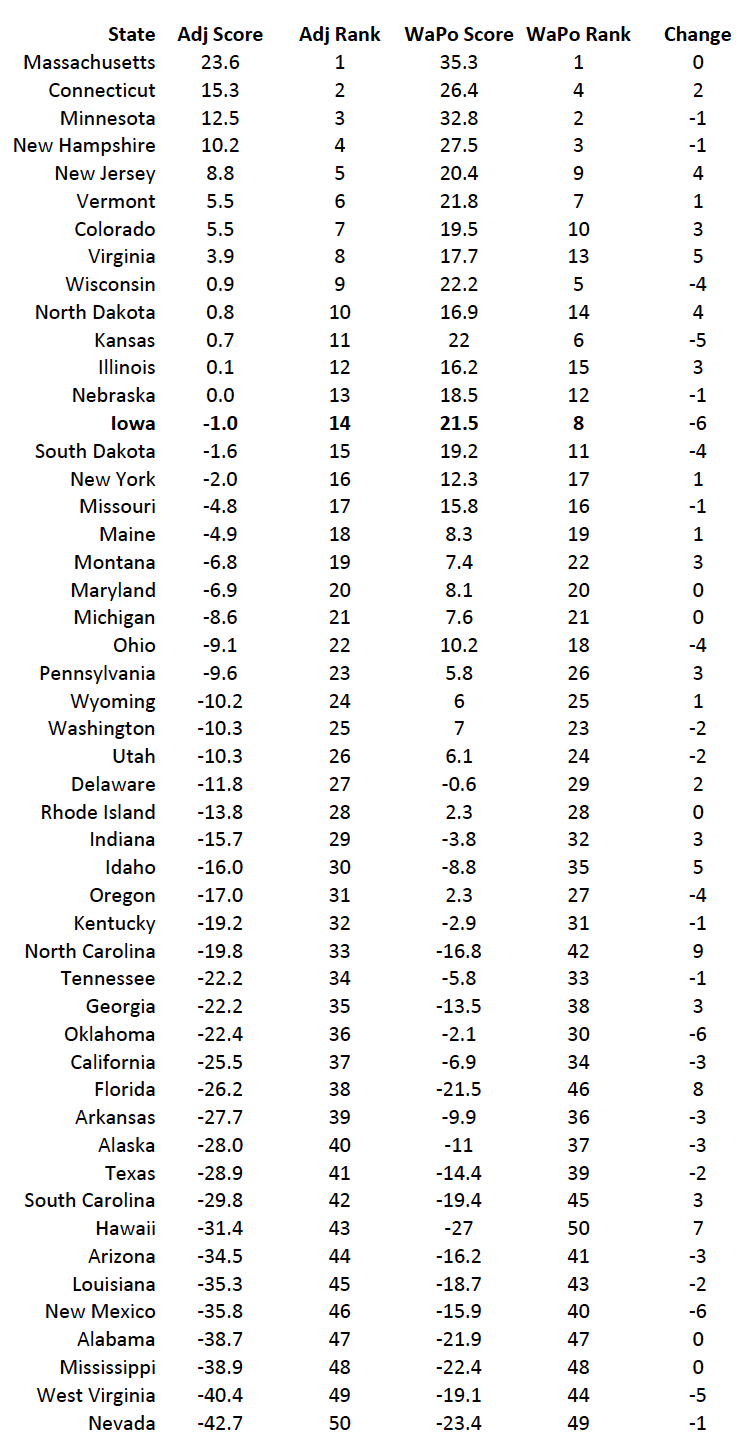
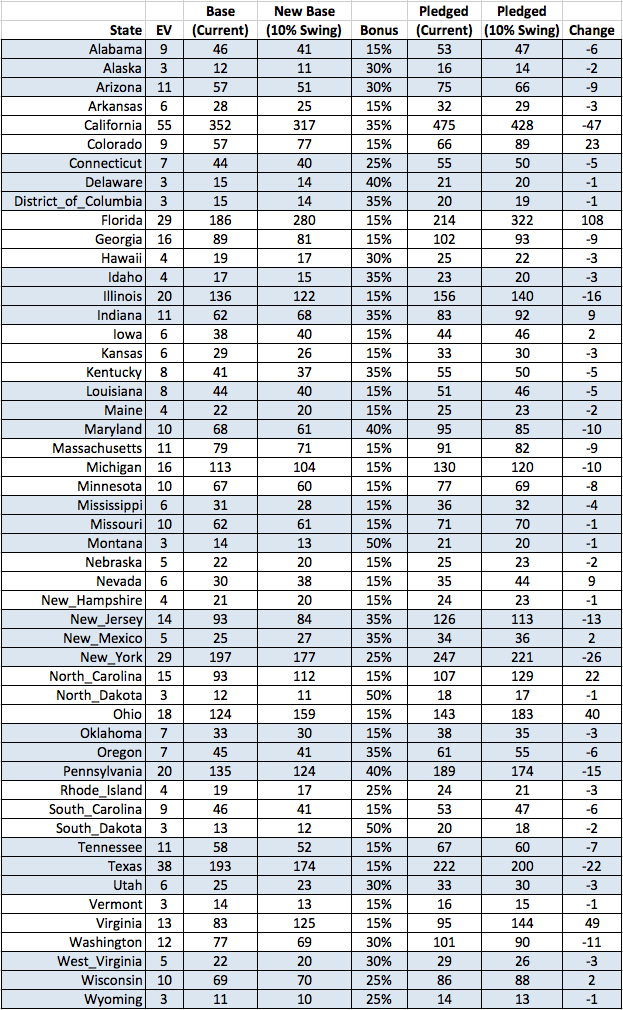
What remains, then, is how to combine this factor with the other considerations. For example, if we use an Allocation Value that is 90% the existing formula, and 10% Swinginess, we get the following:

Screen Shot 2016-03-02 at 1.35.04 PM

If we use these numbers to replot our graph of base delegates per electoral vote versus electoral votes, you can see how the states that have been close in the past get bumped up.

evbp2

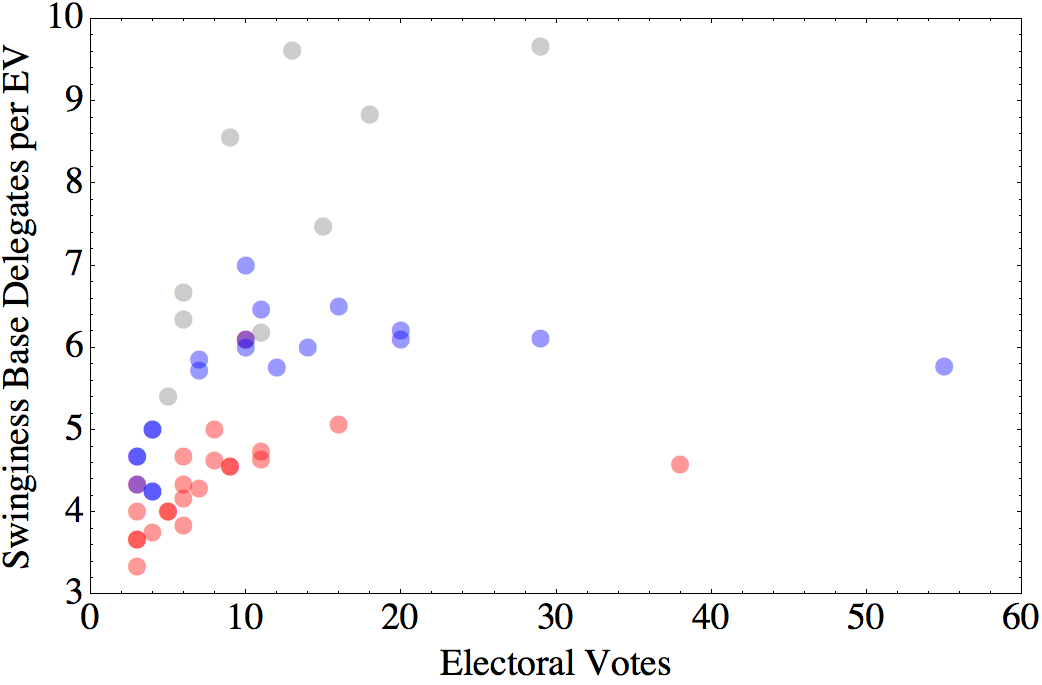
Those four highest points, from left to right, are Colorado, Virginia, Ohio, and Florida.

Is this fair? I’m not actually sure what that means in this context. Keep in mind that nearly 1/3 of the delegates exist either a) to directly express the will of the party elite, or b) to allow the national party to manipulate how and when the states hold their primaries.

A better question might be, would it work? Also, what other consequences might result? It seems intuitive that, for the Presidential election itself, a candidate’s ability to carry Ohio is more important than how much of a landslide they could rack up in California. On the other hand, winning by more (or losing by less) in non-competitive states could make a difference in down-ticket races. And if you discount the voters in solid-blue states too much, you risk alienating your base.

All in all, I suspect something along these lines would be an improvement. At a minimum, it might be a useful way to factor in “electability”, particularly in election years that are more likely to be decided by base turnout than by swaying independent voters.

Don’t Forget Ben Carson, Who is Also Wrong About the Supreme Court

In the wake of Supreme Court Justice Antonin Scalia’s death, Republicans have been climbing all over each other like a less well intentioned pile of zombies in an effort to most loudly claim that President Obama has no right to appoint his successor. Most of the arguments have focused on the fact that we have now entered the final year of Obama’s presidency. As you will recall, back in 2012, the ballots for president clearly stated that the results would only be construed as representing the will of the people for the next three years.

Obviously, these arguments fail any non-disingenuous reading of the constitutional and historical evidence (and contradict arguments previously made by many of those same Republicans), but, you know, the constitution, like the bible, is sacred, infallible, and beyond scrutiny — except when it turns out to be politically inconvenient.

But at the most recent Republican debate, everyone’s favorite cingulocidal maniac Ben Carson offered a different argument:

Well, the current constitution actually doesn’t address that particular situation, but the fact of the matter is the Supreme Court, obviously, is a very important part of our governmental system. And, when our constitution was put in place, the average age of death was under 50, and therefore the whole concept of lifetime appointments for Supreme Court judges, and federal judges was not considered to be a big deal.

Carson is correct that the “average age of death” used to be under 50. In fact, it did not exceed 50 until sometime in the early 20th century. However, as anyone with any educational background in public health or medicine might be expected to know, the dramatic gains in life expectancy have come mostly from reductions in early-life mortality, due to things like sewers, vaccines, and antibiotics. So, unless the Founding Fathers were appointing toddlers to the Supreme Court (spoiler: they weren’t), life expectancy at birth is pretty irrelevant. Here are a couple of graphs (generated here):

Screen Shot 2016-02-17 at 1.46.20 PMScreen Shot 2016-02-17 at 1.47.13 PM

The gray line is life expectancy at birth from 1850 to 2000. The orange and red lines are life expectancy from age 60 for women and men, respectively. Since people are not typically appointed to the supreme court until they are in their 50s, this is actually the relevant data.

So, it is true that someone appointed to the supreme court today might be expected to live longer on average than someone appointed in the 19th century, but only by about ten years. But does that mean that justices given lifetime appointments to the supreme court serve longer than they used to? Not so much. Here are a couple more graphs, constructed from this data:

scp

In the top panel, each diagonal line indicates the term of a single Supreme Court Justice, running from the date and age of appointment to age date and age of death or retirement. The black lines are justices who died in office, red lines are justices who resigned or retired, and blue lines are the eight justices currently serving.

In the bottom panel, each dot represents a single justice. “Mid-Term Year” is the halfway point of their tenure (middle of the line in the top graph), and duration is how long they served (length of the line in the top graph. The line is a ten-point moving average. Current justices are not included.

Notice that justices were not often dying by age 50, even in the early days. There are a couple of interesting trends, though.

First, there’s a transition as we get into the 20th century, when it becomes much more common for justices to retire, rather than die in office. So, while the upper limit on the age we might expect a justice to live to might have increased by about ten years, the upper limit on the age at which they leave the court has not changed substantially in 200 years.

Second, after an initial shake-out (during which many of the justices did not have any sort of legal credentials), the long-term trend from 1820 to 1950 is towards shorter average term lengths (declining from around 20 to around 15 years). Starting with the second half of the 20th century, the trend has been towards longer tenures, with a recent average closer to 25 years. However, if you look at the scatter plot, you can see that this increase is mostly due to the absence of any short-term justices since 1970.

So, it is true that we should probably expect that the next person appointed to the Supreme Court will be there for the next twenty to thirty years, but terms of that length have been around since the beginning.

Actually, Iowa is not quite that smart

Last Thursday, Donald Trump gave a 95-minute speech in Iowa that was variously characterized as “unhinged” (by most people) or “a liberal conspiracy” (by Trump supporters). A significant portion of the speech was devoted to Ben Carson, who had recently overtaken Trump in Iowa polling. As part of his rant, Trump asked, “How stupid are the people of Iowa?”

On Friday, the Washington Post published an informal analysis of the relative intelligence of different states. In answer to Trump’s question:

Well, we can answer that. Not stupid at all. In fact, Iowa is one of the smartest states in America.

This is necessarily hard to figure out, of course, given that “stupid” is inherently contextual and subjective. In order to figure out how smart each state was, we looked at objective measures we had at our disposal.

. . .

The results? Iowa is the eighth-smartest state, behind, in order: Massachusetts, Minnesota, New Hampshire, Connecticut, Wisconsin, Kansas and Vermont. Donald Trump’s home state of New York came in 17th. The bottom five states were Florida, Alabama, Mississippi, Nevada and, in the 50th spot, Hawaii.

The Washington Post analysis combines four metrics: mean IQ score, mean SAT score, mean ACT score, and percentage of college grads. Each of these was converted to a percentage difference from the national median. They were then combined, with IQ being given twice the weight of the other three metrics.

Now, there are a lot of caveats here, which the Post is aware of, and there are certain tweaks one might make. (For example, I might favor Z-scores over percentage difference from the median. Plus, there’s the conflation of intelligence and education, the confounding of those concepts with social and economic opportunity, etc., etc.) But, most of those probably don’t qualitatively change the conclusions of the analysis, and I’m not going to worry about them here.

However, there is something striking when you look at the metrics themselves. There seems to be a trend where states with positive SAT deviations (average SAT scores above the national median) have negative ACT deviations. For example, Alabama has an ACT deviation of -10.3, but an SAT deviation of +4.3. Maine’s deviations are +13.6 on the ACT and -10.4 on the SAT. Massachusetts has a +14.6 on the ACT, but a -0.1 on the SAT. In fact, the correlation between ACT deviations and SAT deviations across all 50 states is r=-0.31. So what the heck is going on?

Screen Shot 2015-11-16 at 2.13.11 PM

Well, as it turns out, the variation in mean test score from state to state is determined almost entirely by test participation. The larger the percentage of kids who take a test, the lower the average test score. That’s presumably because, if 10% of the students in your state take the SAT, it’s not a random 10%. It is the most highly motivated students who are trying to beef up their college applications.

Here are the relationships between participation rate and test score in the data used by the Washington Post (found here and here):Screen Shot 2015-11-16 at 3.01.13 PM Screen Shot 2015-11-16 at 3.01.06 PM

The correlations are r = –0.90 for the SAT and r = –0.81 for the ACT. That means that the vast majority of the variation in test scores from state to state is accounted for by differences in participation.

So, one simple thing to do is to fit a line through each of these distributions. Then, we can use that line to estimate what the mean test score would have been for each state if 100% of the students had taken the test.

First off, after we make this correction, it turns out that the mean ACT and SAT scores in a state are positively correlated (r=0.73). So that makes it seem more plausible that we are looking at two different measures of the same underlying trait (“intelligence” combined with various cultural and economic factors).

Then, using the same formulation as the Post’s original ranking, we get this:

Screen Shot 2015-11-16 at 3.22.39 PM

The “Change” column indicates how many positions up or down a state moves in the rankings after making this adjustment for test participation.

Iowa moves down six spots from #8 to #14, but is still above the average, and still above New York. Other big losers are Oklahoma and New Mexico, both of which also move down six spots.

The biggest winners are North Carolina (+9), Florida (+8), and Hawaii (+7).

So why the shifts? In general, there are SAT states and ACT states. That is, in most states have very high participation in one of the tests and very low participation in the other. North Dakota is an ACT state, with 100% participation in the ACT, but less than 10% in the SAT. Maine is an SAT state, with >90% SAT participation, but only 10% ACT participation. In states like these, the two corrections tend to balance each other out.

The states that move down most dramatically when we make the correction are those that have low participation in one test, but only modest participation in the other. For example, Iowa has <10% SAT participation, but only 67% ACT participation. So, 25-35% of the students in Iowa took neither test. What this analysis suggests is that if they had taken one of the tests, they probably would have brought Iowa’s average scores down.

Conversely, the states that move up are those where a significant fraction of students take both tests. In North Carolina, which jumped from 42nd to 33rd, 100% of students took the ACT, and 60-70% of them also took the SAT.

But note that none of this undermines the central take-home message of the Post’s analysis: Donald Trump is a goddamn moron.

H & R Block Stans are the Worst

A year and a half ago, I posted a rant about the H & R Block ad claiming that Americans who prepare their own taxes overpay by a billion dollars, and that this is a reason to use H & R Block. To summarize, my complaint was this: That billion dollars amounts to an average of about $21 per return. And, by H & R Block’s own numbers, they charge an average of $77 per return.

So, if you go to H & R Block, you will pay on average $56 more (collectively to H & R Block and the IRS) than if you do your own taxes.

Since then, this has become the most commented-on post on my blog, with the overwhelming majority of comments coming from people who work for H & R Block coming to defend their honor (or something). When these comments first started showing up, I thought it might be an astroturfing campaign my H & R Block, which would be sort of a mark of honor, in a way. However, I think that these are genuine, organic comments, which makes me sort of sad.

I always find slavish jingoism depressing, whether in the context of nationalism, or sports, or college loyalty. But in the context of your employer — an employer that does not actually treat the people who work for it all that well, based on many of the comments — is some serious Stockholm Syndrome shit.

Many of the comments cover the same ground. So, rather than responding in the comment thread, I thought I would address things raised in the comments here. Note that these are not actual comments, but paraphrases of whole classes of comments.

Comment: But tax professionals have to study hard every year to keep up with the changes in the tax code!

Fine, I believe that’s true. I fully believe that you have skills and knowledge that I don’t have. It’s just that if the cost to me of using those skills is $77, and the cost of not using them is $21, that’s not a strong incentive to use them. Plus, as I noted in the original post, part of the reason why you need to study so hard each year is because of lobbying done by H & R Block and others to keep the tax code complicated. So yes, you are a hard-working cog in a well-oiled extortion racket. Who’s a hard-working cog? You are!

Comment: I’m not ripping anyone off. In fact, I only get paid a small fraction of the customer fees.

I am perfectly happy to assume no ill will on the part of any of the tax preparers themselves. It’s an annoying ad campaign is all. So the post was really aimed at the marketing department. Also, based on the numbers getting thrown around in the comments, you should all become freelance tax professionals. You could charge half of what H & R Block does and take home more money.

Comment: What about the time it takes to prepare your return? Isn’t that worth something?

Yes. In fact, I made exactly this point in the original post. There are plenty of legitimate reasons to pay someone to do your taxes. Top of the list is that you don’t enjoy doing it, and would rather spend your time doing something else. A+ on basic economics. C– on reading comprehension.

Comment: Aren’t you actually a rival company trying to take down H & R Block, or an ex-employee with a grudge?

No. I’m just a guy who sat through that damn “Get your billion back, America!” ad one too many times.

Comment: If you underpay your taxes, you’ll have interest and penalties.

This is a good point — in fact the only sensible point that came up in the comments that was not addressed in the original post. It’s not just a question of maximizing your deductions. If you make a mistake and underpay, you could wind up owing a lot more. One could do a similar calculation. If, on average, it costs you an extra $56 to have H & R Block do your return, how does this compare with the average penalty size? I don’t know the answer, but your taxes are at all complicated, it’s something to factor in.

Comment: Actually, we’re tax professionals, not CPAs!

Um, okay. I don’t even know where this is coming from. Maybe the fact that I cited statistics from the National Society of Accountants? Maybe one of the other commenters erroneously referred to the tax preparers working for H & R Block as “accountants” or “CPAs”? In any event, I apologize for any confusion, and for inadvertently overrepresenting the credentials required to work for H & R Block, I guess?

Comment: If you don’t like the price, you don’t have to pay.

This I did not know. It would take a special kind of asshole to come in, let someone work through their taxes and fill out the forms, and then take it home without paying. However, if you are comfortable with this, I guess you should definitely take your taxes to H & R Block!

Comment: Something something averages don’t matter every return is different blah blah.

Yes, some people will come out ahead, when the tax preparer finds a huge deduction they were unaware of. Other people will come out worse than the average. That’s how averages work. If you have good reason to know which group you would be in as a customer, that should inform your decision. If you don’t, then the average is useful.

Note that it still may be worth it to pay someone to do your taxes, as it will reduce your variance. In much the same way, you will, on average, pay more for your insurance than you’ll get back. The reason you buy insurance is to hedge against the big losses. Similarly, if there is a possibility of a big error in your taxes, hedging may be the right thing, even if it costs you more on average. However, if we’re talking numbers in the tens or hundreds of dollars, you’re better off playing to the average — over the course of several years, you might expect things to, you know, average out.

When I wrote the original post, I had no opinion one way or the other on the competence of the people who actually do your taxes at H & R Block. However, the nature of many of these comments does give me pause. If the lack of attention to detail and incoherent innumeracy on display here is typical of the people who work for H & R Block, you might look elsewhere.

Hey look! Mississippi and West Virginia lead the Nation in Something Good!

You know, most of the time when you hear “Mississippi leads the nation in . . .”, it is the lead-in either to a joke or a really depressing statistic. But check out this map from the Washington Post:

All 50 states require vaccination, and all 50 provide for medical exemptions, which is good. But 48 of the 50 also provide religious or “personal belief” exemptions.

Personally, I am most bothered by states that have one or the other of these, and not both. Because saying that you can opt out on the basis of a religious belief, but not a personal one puts the state implicitly in the position of deciding what does and does not qualify as a religion. Doing it the other way around just seems weird, since religious beliefs are personal beliefs held for religious reasons, right?

But only two states have the right law: straight-up requirements for vaccination with only medical exemptions. So, if your children’s health is being threatened by sanctimonious morons spouting discredited pseudo-science about autism, or mercury, or argle blargle pharmaceuticals something something, just remember, if you lived in a less retrograde state, like Mississippi or West Virginia, you wouldn’t have to put up with this bullshit.

H & R Block Wants to Rip You Off

So, for the past few weeks, you’ve probably been seeing those ads from H&R Block. You know, the ones where they tell you breathlessly that Americans who are foolish enough to prepare their own tax returns are missing out on a billion dollars. A BILLION DOLLARS!!

The implication, of course, is that the amount paid to the IRS by people who do their own taxes is a billion (BILLION!!!) dollars more than it would be if they had H&R Block do their taxes.

Let’s assume that’s correct. What does it mean for you, the taxpayer?

According to the IRS, about 145 million income tax forms were filed in 2011. According to Pew Research, about a third of people do their own taxes. That means there are just shy of 50 million self-prepared income tax returns filed every year.

So, that billion (BILLION!!!!!) dollars amounts to about twenty-one (21!!!) dollars per self-prepared return.

According to H&R Block’s 2013 Report to Shareholders, during their fiscal year ending on April 30, they prepared 22 million US returns, for which they brought in $1.7 billion, which is an average of $77 per return (including returns that users prepare using their online tools, at prices ranging from zero to $50, depending on the complexity of the return).

That average is actually on the cheap end overall. According the the National Society of Accountants, the average tax preparation fee for returns without itemized deductions is $152. Nevertheless, speaking in averages, H&R Block’s argument is that you should pay them $77 so that you can pay $21 less to the US government.

There are legitimate reasons to use a tax preparer. For instance, there’s the calculation of how much time you would save by paying someone to do your taxes, and how much your time is worth to you, factoring in how much you like or dislike doing your taxes. What pisses me off is the way these ads exploit the fact that a billion is a large number to imply a big payoff.

It’s like saying, “Americans spend millions of dollars every year on snow shovels. So you should hire me to shovel your driveway. I’m not going to tell you how much I’ll charge you, but you can (probably) safely assume that it will be less than millions of dollars!”

On a related note, keep in mind that, like other corporations that make their money from tax preparation, H&R Block spends millions of dollars every year lobbying congress, much of it to oppose legislation to simplify the tax code.

Anonymous comes to Montclair

So, a couple of years ago we moved to Montclair, NJ, in part because of the excellent public school system. There was some excitement here last Friday, when some “assessments” were posted on the web in advance of their being administered to students.

There is some confusion (at least on my part), and some conflicting reports about what, exactly these tests are for. They are some combination of:

  1. Evaluation of pedagogical methods
  2. Evaluation of teachers
  3. Evaluation of students

In any event, these tests were supposed to be given starting this week, but 14 of the “more than 60” tests were posted online, which, of course, severely compromises the integrity of the tests. The tests were quickly taken down (although nothing ever really disappears from the internet), and the next couple of days were filled with pretty much what you would expect: outrage and conspiracy theories from parents; defensiveness and corporate double-speak from the superintendent’s office.

Then, today, an Anonymous video went up claiming responsibility for the hack . Suddenly, things get interesting. Go here to watch the video. Go here to read the commentary from Baristanet (the local online paper) — entertaining in part because of the apparent lack of familiarity with Anonymous.

Of course, the usual caveats apply. Due to its open, self-organized nature (anyone can generate an Anonymous-style video), it is difficult to know if Anonymous was actually responsible (as opposed to taking credit after the fact), or what it even means for “Anonymous” to be responsible. However, it takes something that looked a lot like run-of-the-mill bureaucratic incompetence and reframes it as a guerrilla struggle against the corporate takeover of public education.

So, what’s the story then?

Well, now that there’s an Anonymous video involved, I’m going to find out.

This Spam REALLY Doesn’t work right now

So, like you, I get a lot of spam e-mail, much of it some variant of the Nigerian 419 scam.

Here’s the one I got today:

Dear Sir
I want to invest in your country. Anyway, my name is. John Mark from Liberia presently staying in Ghana.Already, I have gone through your profile, and I considered you to be credible and competent enough to handle a big project of this nature,which is the reason why I decided to contact you.
Personally, I would like to go into business partnership with you, so that you can assist me to invest and manage my fund there in your country.
The only thing I am considering is the tax, I don’t know how much tax the Government of your country will take from the funds that I want to invest in your company and I don’t
know if there will be any other requirements from us. I intend to invest jointly with you.
The purpose of this mail is to open up communication with you to enable us know each other as regards to our plan to invest our money properly with you.
God bless you as we will be looking forward to hear from you urgently.
Yours faithfully,

John Mark

Here’s the thing. If you’re trying to scam an American right now, when the government is shut down as a result of a crazy-ass blood feud over Obamacare, and when we are just a couple of days away from defaulting on our Federal debt, when the fiscal practices that led to the 2008 crash have, if anything, intensified over the course of the recovery (which was only a recovery at all for the very richest Americans), you can’t lead with “I want to invest in your country.”

That opening pegs you as a scammer, or, worse, a moron.

Steve Lonegan on Syrian “Others”

So, as some of you may know, we’ve got a special election happening tomorrow here in New Jersey, pitting Democrat Cory Booker, the current Mayor of Newark, against Republican Steve Lonegan, the former Mayor of Bogota. The race got a lot of headlines in the past few days after Rick Shafan, a (since fired) senior staffer with the Lonegan campaign, said that Booker’s communications with a Portland stripper sounded like “what a gay guy would say.” He went on to explain in stomach-churning detail what he (as a representative of straight guys everywhere) would have said to the same stripper. If you haven’t read about it, check it out.

But back in September, we got a recorded phone call from Lonegan, urging us to come to a rally in Montclair against military intervention in Syria. Now, while I doubt that I agree with Lonegan on just about any other issue, I am glad that we found a way not to get involved in another war (even if it was going to be “just” airstrikes).

The American’s-bombing-people-in-Syria issue, is settled, at least for the moment, but there was something telling in the phrasing of the phone message. Here’s my transcript:

America is on the verge of another war, a war we can not afford. A war where we do not belong. I’m Steve Lonegan, I’m the Republican candidate for the United States Senate. Please join me this evening in Montclair at 12 Church Street for our anti-war rally.
We should not be putting our money, our troops, and our nation in harm’s way in a war in Syria that will result in the death of thousands of Syrian Christians, Jews, and Others.
We simply do not belong there. There is no excuse for this war. None. Please send our message to our elected representatives across this state and across this country: “No . . .”

That’s where our answering machine cut off. I assume the message was something along the lines of “No war!”

The interesting part of the message was “Syrian Christians, Jews, and Others.” Hmmm . . .

Here’s my read on this. I have no evidence to suggest that Steve Lonegan himself has anything against Muslims. He might, but I’m happy to give him the benefit of the doubt here.

However, it does seem clear that he is unwilling to say that he is against killing Muslims.

Here’s how I picture the strategy meeting:

STAFFER 1: Okay, it looks like Obama is going to war against Syria. We’re tying Booker to Obama, so we need to come out against the war.

STAFFER 2: But we have to be careful. Killing Muslims is still polling very strong with our base.

STAFFER 1: I’ve got it! We refer to Syrian Muslims as “Others”.  That way we avoid appearing sympathetic to them, and in fact, contributes literally to the “Othering” of Muslims, sensu De Beauvior.

STAFFER 2: We’ve got a mole!

Sadly, STAFFER 1’s body was never found.